As we approach year end, Marc Jimenez - founder of CAM Investor Solutions - shares some helpful investment reminders.

2021: How High is Too High?
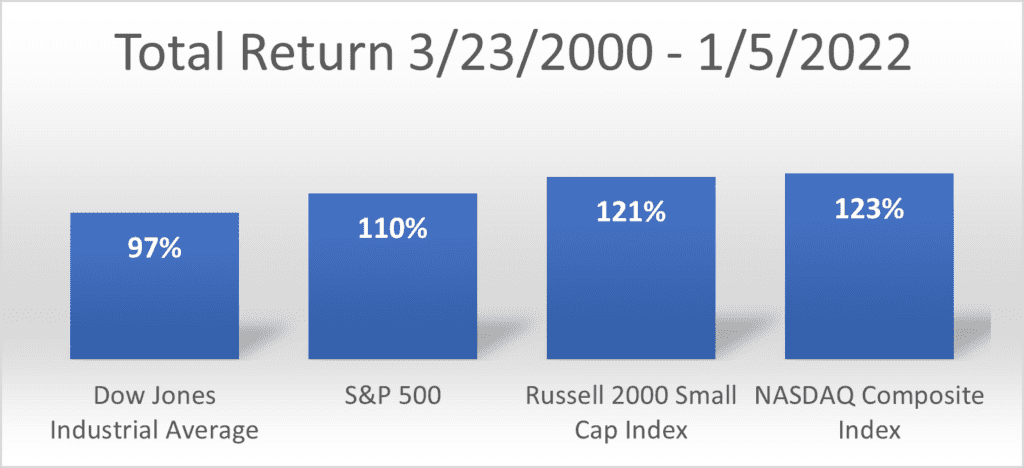
Stocks surged in 2021, continuing their torrid recovery from the pandemic-fueled sell-off in February and March 2020. Since bottoming out at 18,591 on March 23rd, 2020, the Dow Jones Industrial Average has gained a whopping 97%. And that’s actually on the low end of the major market indices, as seen in the chart below:

These gains came against a backdrop that could hardly be described as “cheery.” COVID mutations, supply-chain disruptions, and rising inflation have dominated the news cycle since the 2020 economic shut down. Yet stocks, as they often do, climbed the wall of worry. The powerful recovery in equities these past 22 months underscores one of the central pillars of our investment philosophy: Dramatic gains often come when we least expect it, and the only way to be sure we reap the rewards is to be fully invested at all times.
Yet, today, the talking heads in the financial media are warning us about stocks being “overbought,” “due for a downturn,” and other ominous phrases that all point to the same underlying theme:
Run! Get Out! Protect yourself and your money before it’s too late!
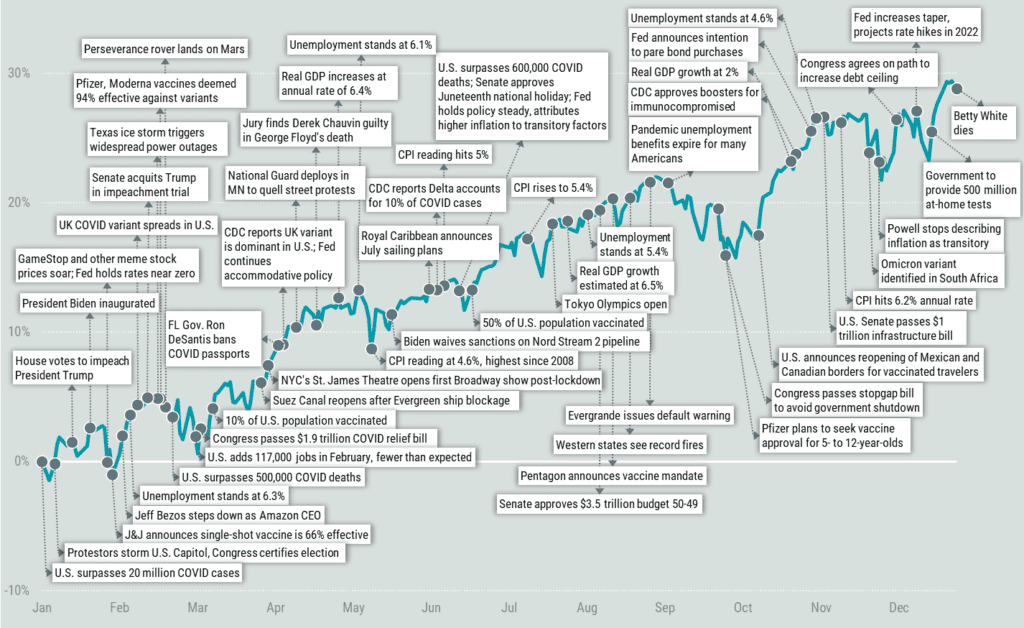
S&P 500Index Total Return and Headlines in 2021

Let’s break this down, shall we?
First, what exactly does “too high” mean? The stock market has proved to be a reliable predictor of future corporate earnings for more than a century. While there is undoubtedly noise in the system from time to time that distorts that relationship, over the long run the return of equities is very directly related to the expected future earnings of publicly-traded companies. When that relationship gets distorted in the short term, we see the kind of market volatility we’ve seen the past two years. Whether the bull market that began in March 2020 has outpaced future earnings isn’t known by us or anyone else. It’s all the stuff of speculation and debate; it’s only in retrospect that we’ll know for sure.
Second, when will we know it’s no longer “too high?” The price-to-earnings ratio of the S&P 500 is 29.58, relatively high on an historical basis (a higher value generally indicates a greater cost for a lower return, and a lower value generally indicates a greater return for a lower cost). But it’s nowhere near as high as the stratospheric P/E’s seen in the dot-com bubble in the early 2000s or the real-estate bubble of the mid 2000s. It’s also worth noting that the average annual return of the S&P for the 15-year period ending December 31, 2021 was 10.12%, very much in line with its historical long-term average return. So, while a major decline may indeed happen in the near term, it’s far from a foregone conclusion.
Third –and most importantly –even if a major decline does happen in the next few months, it begs the question: then what? Do stocks stay down forever, never to recover? Of course not, because that’s not how capital markets work. Eventually, stocks become a bargain too tempting to resist, and the recovery commences swiftly.
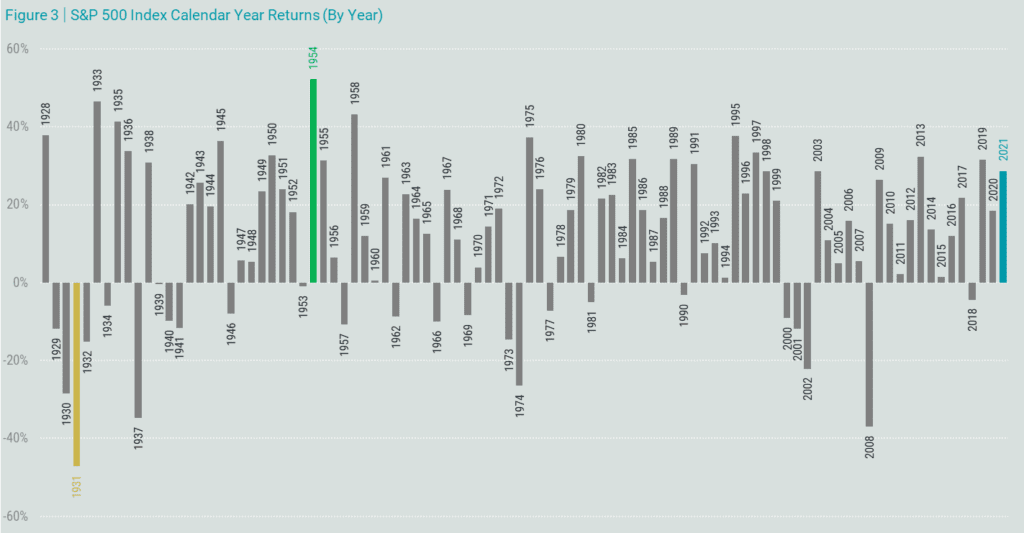
Downturns are but temporary detours on the long, upward climb that stocks enjoy. Sometimes the detours are minor distractions, and occasionally they are major disruptions. But in no case has the stock market ever halted its upward climb given a long-enough holding period.
S&P 500Index Calendar Year Returns (By Year)

The whole point of creating an investment policy statement and building an efficiently diversified portfolio is to seek the balance between the return you need and the volatility you can handle. When we focus on process, not current events or subjective guesses about whether stocks are too high, we greatly increase the odds of attaining your long-term investment goals.
As we have noted many times, individual investors have a long, depressing history of chasing performance. The hot stock or fund du jour is a temptation too great for many investors to resist. Alas, most invariably arrive too late to the party and are left holding the bag.
A recent and relevant example of this is the ARK Innovation Fund (ARKK), an exchange-traded fund (ETF) that invests heavily in large tech and cryptocurrency companies. ARKK went on an absolute tear from February 2018 through February 2021, posting a total return of more than 290% –more than five times the S&P 500’s return for the same time period.
Over the long term, about 90% of active managers under perform their market benchmarks, and even the slim minority who do beat the market usually do so by only a percentage point or two. So, when a fund outperforms the broad market by a multiple of 5X, suffice to say it’s due for a return to reality. This is known as reversion to the mean – the statistical reality that outliers don’t remain outliers forever, or even for long.
Logic would dictate the recent high flyers are the very ones to most avoid. Yet, predictably, investors flocked to ARKK in 2020 and early 2021. From a relatively meager asset base of $116 million in 2017, the ARK Innovation fund’s assets-under-management exploded to $25.5 billion (with a “b”) by 2021. Nearly all the inflows came after the fund had already posted most of its staggering returns.
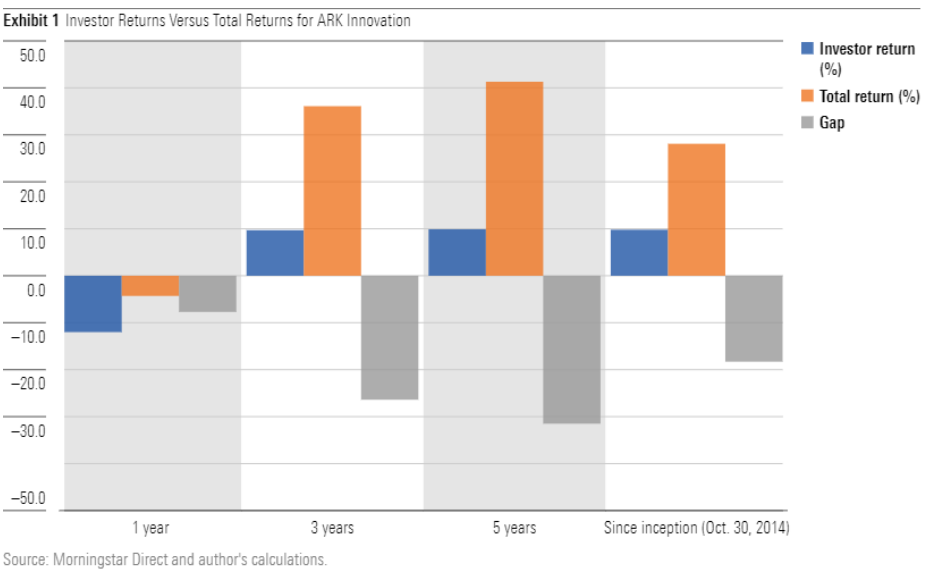
You already know how this story ends, but we’ll tell you anyway. Since last June, ARKK has lost more than 40%, even as the S&P 500 gained 11.50%. In a well-researched analysis on Morningstar.com, Amy Arnott lifted the hood on ARKK and found that the average investor’s return in the fund was a mere fraction of the fund’s stated return:

Keep in mind that’s the average investor return for the fund, which means there were many who fared much worse.
It would indeed be nice to somehow get in on the next high-flying stock or fund before it goes on its hot streak, just as it would be nice to pick the winning Powerball lottery ticket. Both require either blind luck or clairvoyance. The former is no basis for an investment strategy, and the latter would render an investment strategy unnecessary.
As we enter 2022, stay focused on your goals and tune out the ominous headlines yelling “Get out!” or fad trends enticing you to “Buy this hot investment!”. As always, we appreciate our relationship with you, and we are here to help.
Source: ICI; FactSet; Avantis Investors; Bloomberg; Morningstar; Capital Directions. M & A Consulting Group, LLC, doing business as CAM Investor Solutions is an SEC registered investment adviser. As a fee-only firm, we do not receive commissions nor sell any insurance products. We provide financial planning and investment information that we believe to be useful and accurate. However, there cannot be any guarantees. This blog has been provided solely for informational purposes and does not represent investment advice or provide an opinion regarding fairness of any transaction. It does not constitute an offer, solicitation or a recommendation to buy or sell any particular security or instrument or to adopt any investment strategy. Any stated performance does not reflect the expenses associated with the management of an actual portfolio. Past performance is not a guarantee of future results. Diversification does not eliminate the risk of market loss. Charts and graphs provided herein are for illustrative purposes only. There are many different interpretations of investment statistics and many different ideas about how to best use them. Nothing in this presentation should be interpreted to state or imply that past results are an indication of future performance. Tax planning and investment illustrations are provided for educational purposes and should not be considered tax advice or recommendations. Investors should seek additional advice from their financial advisor or tax professional.


