It’s been said that the stock market does not like surprises…

How do Falling Interest Rates Affect My Investments?
The question for over a year has been – when will the Fed cut interest rates? Now that the Fed has started cutting rates, everyone wants to know – how will falling interest rates affect my investments.
In September, the Federal Reserve (Fed) made its first cut to the federal funds rate since March 2020 – a 0.50% reduction. Now, expectations from both the Fed and market participants are for more cuts. Recently released Fed estimates project two more 0.25% cuts in the policymakers’ last two meetings of the year. They also estimate the fed funds rate to be about 3.4% by the end of 2025. The current target rate is 4.75 – 5.00%.
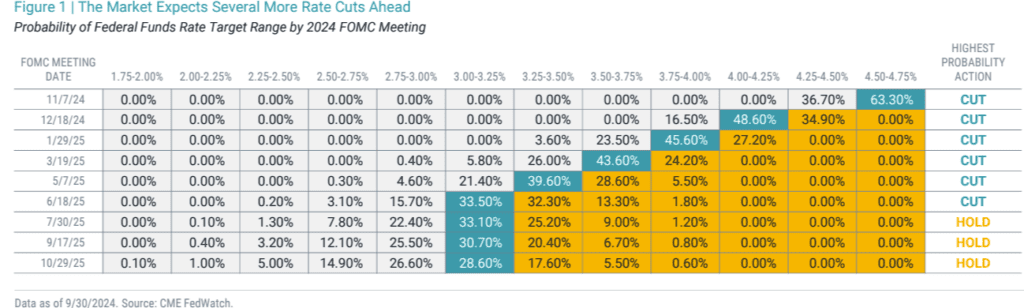
As of the market close on September 30, market expectations were slightly more aggressive. Prices on fed futures contracts suggested that the highest probability outcomes are two more cuts in 2024 (total reduction of 0.75% over those two meetings) and cuts in each of the first four meetings of 2025. That would bring the federal funds rate to a target range of 3.00-3.25%. Figure 1 shows all implied probabilities by target rate range for the next nine Federal Open Market Committee (FOMC) meetings.
The History of Fed Rate Cuts
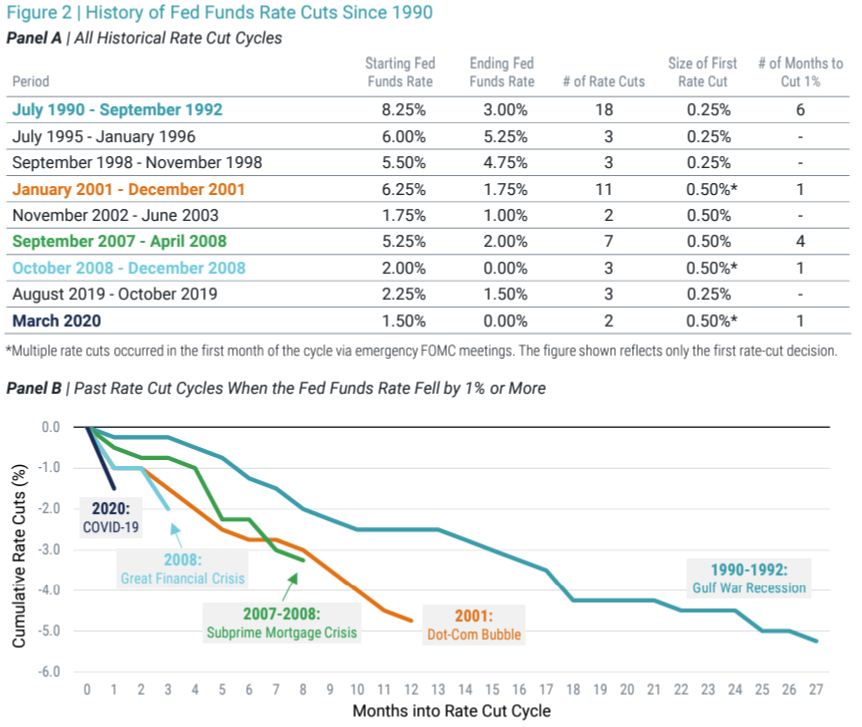
If these predictions on the path of interest rates feel overzealous, take a look at how the Fed has handled interest rate decisions in the past. In Figure 2 Panel A, we share details on each time the Fed has lowered the fed funds rate since 1990. Before that, the Fed didn’t target a specific fed funds rate.
We observe nine distinct periods of rate cuts, and it’s clear that some have quite different characteristics than others. Four of the nine periods saw the fed funds rate decline by less than 1%. During the other five periods, the average rate change from the first to the last rate cut was more than 3% and, in each case, with a cumulative cut of at least 1% occurring within six months. Figure 2 Panel B depicts those five periods showing cumulative rate cuts by month after each cycle began. It’s evident that historically when the Fed has cut rates in similar magnitudes to their current projections, it has happened fast.
The Impact of Bond Duration During Falling-Rate Environments
For many investors, the question now is what these expected rate cuts could mean for their portfolios. With more than $5 trillion currently in government money market funds, a more specific question is what impact will duration have during a period of declining interest rates.
With money market funds, the attraction of late has been yields generally around 5% without much concern for price sensitivity to changes in interest rates. That also means that as rates on short-term bonds come down, overall yield for money market funds should decline without any potential benefit from price appreciation.
Bond prices tend to go up as yields go down, but money market investors don’t receive this benefit due to the amortized cost structure and short duration of the underlying securities.
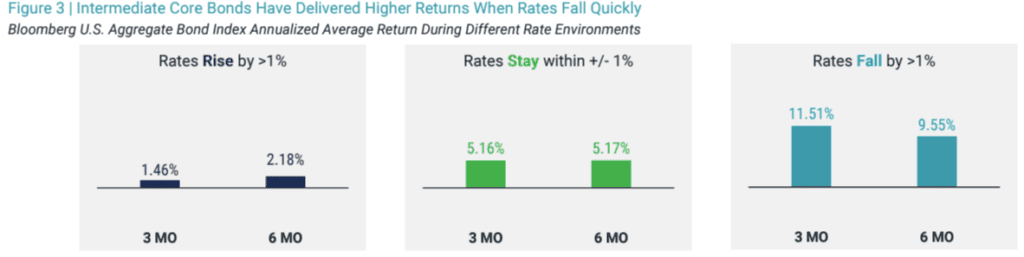
We examined how intermediate core bonds have performed in past interest rate environments, using the Bloomberg U.S. Aggregate Bond Index since its inception in 1986. To look at the scenario of a quickly declining rate, we’ve computed the analysis over short time horizons: three months and six months.
The results are shown in Figure 3, which includes annualized average returns for the index for each time horizon during periods when rates rose by more than 1%, when rates were relatively stable and stayed within plus-or-minus 1%, and when rates fell by more than 1%. We find that historically, intermediate core bonds have delivered significantly higher annualized average returns when rates fall quickly versus in more stable or fast-rising interest rate environments.
How Stocks Have Performed When Rates Fall
Adding to our analysis on interest rate changes, we calculated the performance of U.S. stocks (total market and small-cap value) since 1976. Now that we are presenting multiple asset classes, we narrow the scenarios to when rates rise and fall over six-month periods for simplicity.
In Figure 4, we show that whether rates have risen or fallen over six-month periods, both the total market and small value stocks have delivered strong positive returns. Perhaps more interesting is the spread in average returns between small-value stocks and the total market during the different environments.
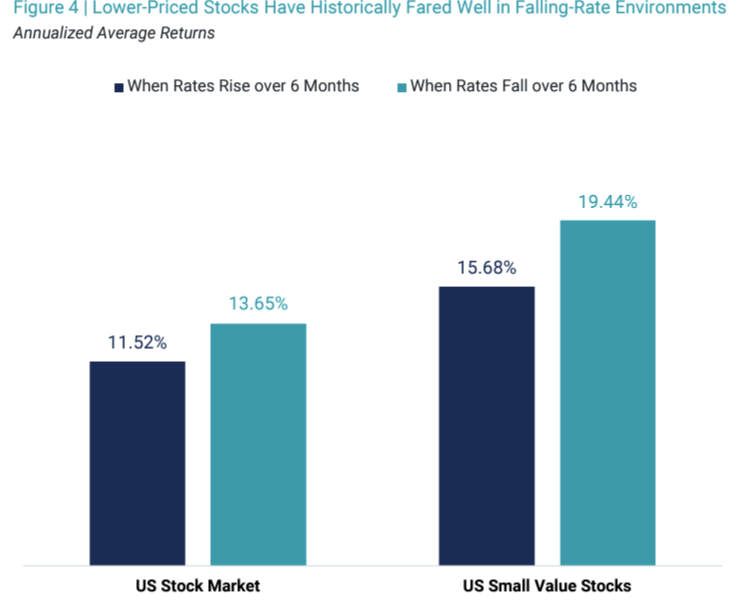
The difference in average small value and total market returns when rates rise during the sample period is 4.2%. When rates have fallen, the outperformance for small-value stocks over the market rises to 5.8%. So, while low-priced stocks don’t outperform the market every month or even every year, periods of falling rates have historically been favorable for value investors.
In Summation
While nothing is ever guaranteed with respect to the path of interest rates, the expectations are clear and largely aligned between the Fed and the market that the fed funds rate is currently well above the so-called “neutral rate” and should decline going forward.
It’s still unclear as to how quicky the Fed will cut rates, but the data tells us that historically, in quickly falling rate environments, extending duration beyond cash or money market funds has, on average, led to better outcomes for investor portfolios. And, as we believe is true every day, considering valuations within equity allocations is expected to benefit investors, but historically that benefit has been more impactful when rates are going down.
If you’d like a second opinion on your investments and how they may perform in the current or future investment envorinment, please reach out to us. We’d love to help you take a deeper look at your portfolio.
Source Disclosure
Avantis Investors
CAM Disclosure
M & A Consulting Group, LLC, doing business as CAM Investor Solutions is an SEC registered investment adviser. As a fee-only firm, we do not receive commissions nor sell any insurance products. We provide financial planning and investment information that we believe to be useful and accurate. However, there cannot be any guarantees.
This blog has been provided solely for informational purposes and does not represent investment advice. Nor does it provide an opinion regarding fairness of any transaction. It does not constitute an offer, solicitation or a recommendation to buy or sell any particular security or instrument or to adopt any investment strategy.
Past performance is not a guarantee of future results. Diversification does not eliminate the risk of market loss. Tax planning and investment illustrations are provided for educational purposes and should not be considered tax advice or recommendations. Investors should seek additional advice from their financial advisor or tax professional.
Related Posts