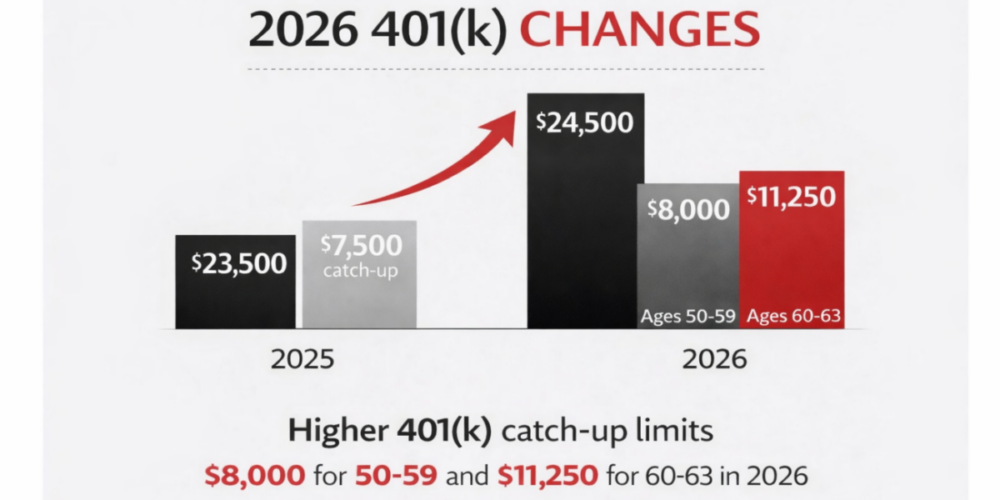
Tax saving strategies 2026 go far beyond higher 401(k) limits. For…

A Cycle of Investor Emotions
In times of unimaginable suffering such as the Ukrainian people are experiencing at the hands of their Russian invaders, it can feel cold-hearted to consider such crises from a financial perspective. But there’s no avoiding the reality that the war, and the sanctions heaped upon Russia by nearly the entire world, have sent shockwaves through vast swaths of the capital markets, from commodities to stocks and bonds to precious metals.
As we noted in previous client letters, a downturn in stocks isn’t surprising given the nearly continuous upward climb they had enjoyed since March 2020. Obviously, the stock market doesn’t go upward forever; in fact, historically, the S&P 500 experiences a 10% downturn at least once a year, and a 20% decline on average every 3.6 years. The reasons attributed to stock declines are always unique to the current time period, but the reality is that, sooner or later, some combination of circumstances will send the market into a prolonged decline.
This isn’t to diminish the unknowns surrounding the outcome of the Russia -Ukraine war, or the fate of Vladimir Putin and the entire Russian nation. Clearly, the stakes are real and significant, not just regionally but globally. The question, though, is what should long-term investors do in the face of such unknowns? Here are some things to keep in mind in that regard:
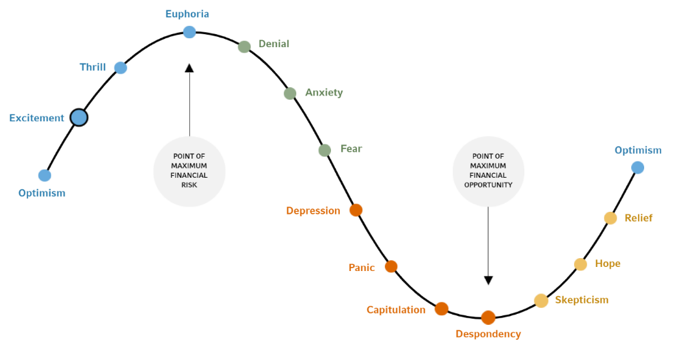
- When current events raise the anxiety of investors, fear becomes the dominant emotion driving the stock market in the short term. Panicky individual investors flee the market, sending stocks lower and creating a feedback loop that causes even more selling.
It is not, however, an endless feedback loop. Eventually, the so-called animal spirits of the stock market kick in and investors (mostly institutional) rush in to buy stocks at what are essentially sale prices. These reversals in market sentiment often happen rapidly and just as things seem gloomiest. Typically, individual investors who bailed out of stocks in the downturn miss most or all of the ensuing recovery.
This is illustrated perfectly in the “Cycle of Investor Emotions” chart that has circulated in various forms for years:

- Both the peaks and valleys on the cycle represent the times when investors are at their most emotional and thus vulnerable to making emotional investment decisions. They fall victim to recency bias, which is the tendency to project the current situation indefinitely into the future and make decisions accordingly.
Recency bias is what caused otherwise rational people to throw all their money into dot-com stocks in the late 1990s and take on seven-figure mortgages in the mid-2000s. It’s also what caused them to sell their stocks at a loss of 50% or more on the downside of those cycles, when all seemed lost and no hope was on the horizon. - When momentous, unexpected events occur, fear triggers our survival instincts. We feel a deep need to take control – to do something. Yet doing so is almost always the wrong thing to do – something that will always and only be apparent in hindsight. That’s when it’s good to keep in mind the sage advice of Vanguard founder John Bogle:
“Don’t just do something –stand there!”
Stay calm and invest on during these tumultuous times. Go see a new movie or get lost in a good book, turn off the talking heads spreading fear and doubt about your retirement and life savings. And if you need someone to talk to or ask questions about the markets and interest rates – give us a call. That’s what we’re here for, to help smooth out the emotional or mental rollercoaster ride you may be on.
M & A Consulting Group, LLC, doing business as CAM Investor Solutions is an SEC registered investment adviser. As a fee-only firm, we do not receive commissions nor sell any insurance products. We provide financial planning and investment information that we believe to be useful and accurate. However, there cannot be any guarantees. This blog has been provided solely for informational purposes and does not represent investment advice or provide an opinion regarding fairness of any transaction. It does not constitute an offer, solicitation or a recommendation to buy or sell any particular security or instrument or to adopt any investment strategy. Any stated performance does not reflect the expenses associated with the management of an actual portfolio. Past performance is not a guarantee of future results. Diversification does not eliminate the risk of market loss. Charts and graphs provided herein are for illustrative purposes only. There are many different interpretations of investment statistics and many different ideas about how to best use them. Nothing in this presentation should be interpreted to state or imply that past results are an indication of future performance. Tax planning and investment illustrations are provided for educational purposes and should not be considered tax advice or recommendations. Investors should seek additional advice from their financial advisor or tax professional.


