We’ve said before that the most dangerous four words in investing…

How did investment markets perform in 2024?
After a 26% total return from the S&P 500® Index in 2023, few predicted 2024 would deliver another big year of gains for U.S. stocks. But it did.
Not only did the S&P 500 post a 25% return for the year, but the index reached 61 new all-time highs. Together, 2023 and 2024 form the best two-year period for U.S. stocks since the late 1990s.
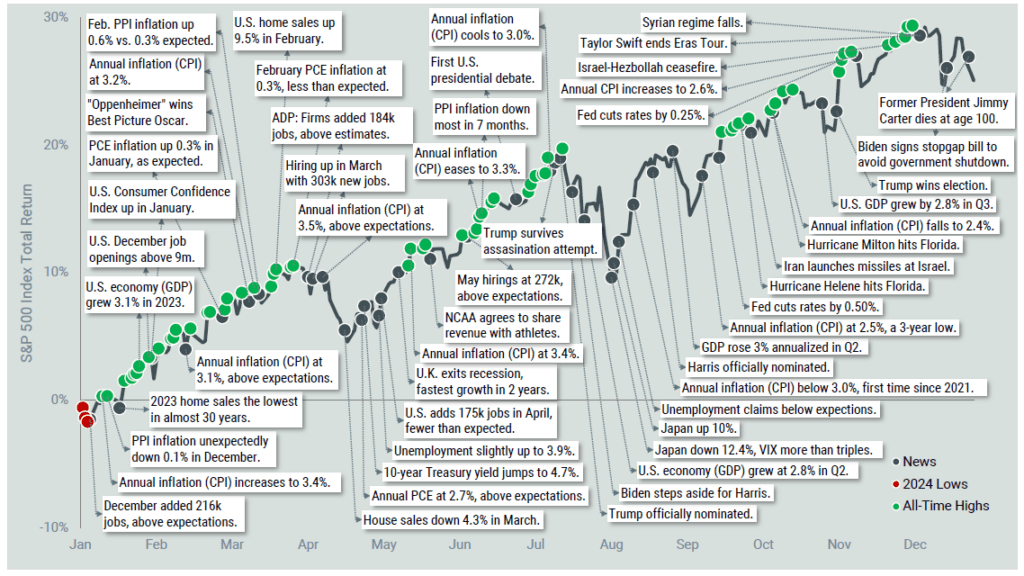
That’s great news for investors, but it just scratches the surface of their experience throughout 2024. Figure 1 below provides additional perspective, complete with the full-year cumulative return of the S&P 500 and various market, economic and pop culture headlines.
Figure 1: S&P 500 Index Return and Headlines in 2024
Gross Domestic Product (GDP) is a measure of the total economic output in goods and services for an economy.
This illustration reminds us of how economic uncertainties, the November election, geopolitical tensions and other factors challenged investors. Even those all-time market highs likely contributed to anxiety, as some investors fear they indicate a possible correction ahead. Ultimately, we believe the year provided a lesson in maintaining discipline and a long-term focus.
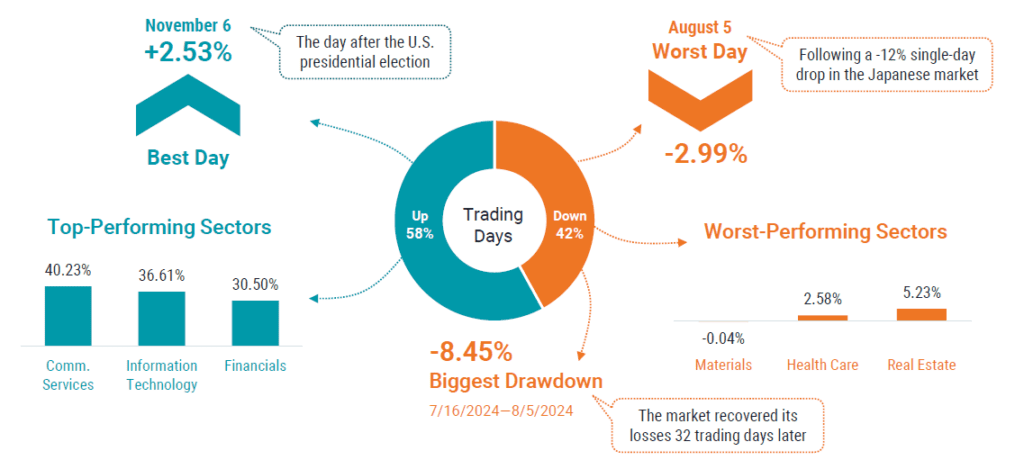
Figure 2 provides a deeper look into the numbers behind the market in 2024. As you might expect, U.S. stocks had more up days than down days, and some days were better than others, while some days weren’t great at all.
Not all companies or sectors in the S&P contributed equally to the strong results. While returns were positive for all but one sector on the year, there was wide dispersion among them. Communication Services was the top-performing sector, besting materials stocks, the lowest performer, by more than 40%.
Figure 2: S&P 500 Index by the Numbers in 2024
The U.S. economic and interest rate picture also remained in focus for investors in 2024. We came into the year with indications that the Federal Reserve (Fed) would likely begin cutting rates before the end of the year. This finally became a reality with a 0.50% cut to the federal funds rate in September. Quarter-point cuts followed in November and December, bringing the target rate to a range of 4.25% to 4.50% at the close of the year, down from 5.25% to 5.50% at the start.
Figure 3 summarizes some of the most watched economic metrics in 2024. The key takeaway is that while much discourse surrounded month-to-month changes in unemployment and inflation, the U.S. economy closed 2024 on solid ground. Inflation still sits closer to the Fed’s 2% target than a year ago.
Figure 3: The U.S. Economy Was Resilient, Yet Again, in 2024
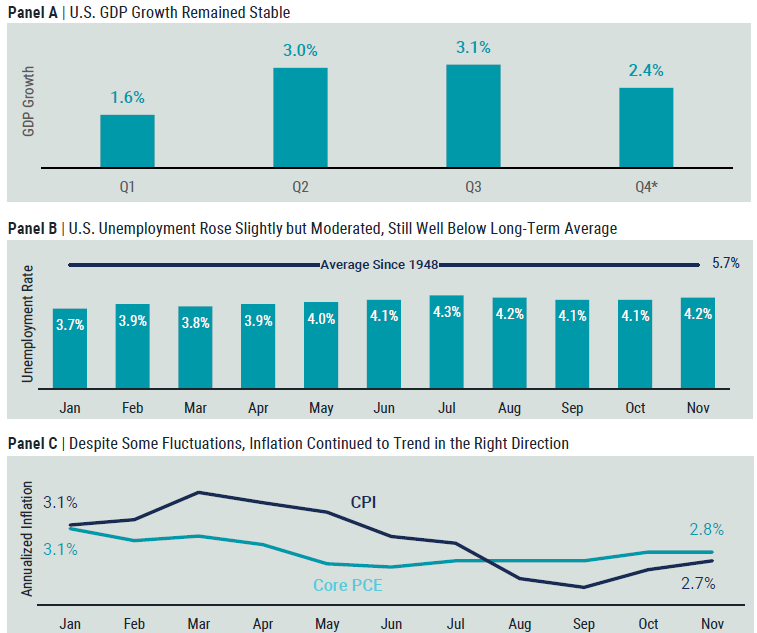
Panel B Source: FRED. Data from 1/1/1948 – 11/30/2024.
Panel C Source: U.S. Bureau of Labor Statistics. Data from 1/1/2024 – 11/30/2024.
And how did the bond market react to all this news in 2024? In terms of performance, returns of the Bloomberg U.S. Aggregate Bond Index, a common proxy for the total U.S. bond market, were positive but modest in magnitude compared to stocks, at about 1.25% on the year. The real story was the dramatic change in U.S. yield curves and its implications for investors going forward.
Coming into 2024, the U.S. Treasury curve had been inverted since April 2022 when the yield on 10-year maturity Treasury bonds first became lower than the yield on shorter-maturity, two-year Treasuries. This contrasts with a “normal” yield curve when yields increase with longer bond maturities. In other words, you earn a higher yield for investing in bonds that will take longer for your principal investment to be returned.
As short-term rates rose behind Fed rate hikes throughout 2022 and early 2023, investors could earn higher yields on very short-maturity bonds. Government money market funds became a popular choice for their relatively high yields with low risk. This environment held until around the time of the Fed’s first rate cut in September. At that point, the more-than-two-year inversion period for the U.S. Treasury yield curve ended, and the shift toward normalization took hold.
Figure 4 presents a snapshot of the U.S. Treasury curve at the start and end of 2024 (Panel A) and BBB-rated corporate bonds at the same dates (Panel B). The year-over-year change from inverted to normal is easy to see.
Figure 4: Getting Back to Normal in 2024
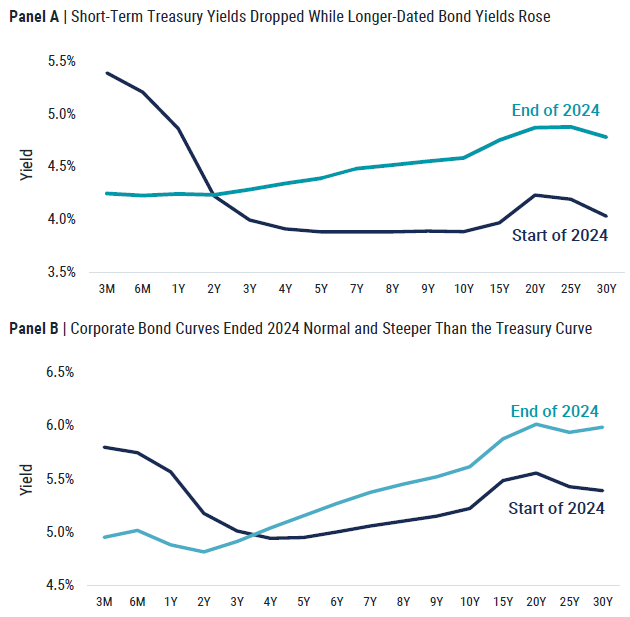
For investors today, this means that the interest that can be earned on short-term Treasuries and money market funds has declined. Higher yields can now be earned for extending duration (or buying out the curve to longer maturities). But that’s not all. With a normally shaped curve, extending duration also provides opportunities to take advantage of expected price appreciation (i.e., if bond yields go down as bonds mature, their prices will go up).
Some bonds across different sectors will have higher expected price appreciation and returns than others. Indexed bond funds simply buy the market without considering expected returns or diversification across issuers and issues, so there are opportunities for potential outperformance by taking these key considerations into account.
Wrapping Up and Looking Ahead
In many respects, 2024 was a tremendous year for investors. Does that mean we enter 2025 without uncertainties or potential anxieties? Hardly so. The truth is that investors always face uncertainty. It comes with the territory, but that doesn’t necessitate a bad investment experience if you stay disciplined.
Think back to the start of 2024. There were plenty of reasons then to doubt stocks’ performance in the year ahead, but those who stayed invested throughout the year were rewarded with a handsome return.
Of course, not every year will be so kind. Go back to 2022, a year when the S&P 500 ended down nearly 20%. Investors endured some pain that year, but those who continued to stick with the market earned that back and more in the years that followed. Staying the course paid off, as is often the case over time.
So, who knows where 2025 will take us, but if we’re betting on anything, it’s hanging on to sound, old-fashioned investment principles like broad diversification and a long-term outlook. Their benefits are as certain as you can get when investing for a better future.
Source Disclosure
CAM Disclosure
M & A Consulting Group, LLC, doing business as CAM Investor Solutions is an SEC registered investment adviser. As a fee-only firm, we do not receive commissions nor sell any insurance products. We provide financial planning and investment information that we believe to be useful and accurate. However, there cannot be any guarantees.
This blog has been provided solely for informational purposes and does not represent investment advice. Nor does it provide an opinion regarding fairness of any transaction. It does not constitute an offer, solicitation or a recommendation to buy or sell any particular security or instrument or to adopt any investment strategy.
Past performance is not a guarantee of future results. Diversification does not eliminate the risk of market loss. Tax planning and investment illustrations are provided for educational purposes and should not be considered tax advice or recommendations. Investors should seek additional advice from their financial advisor or tax professional.

