Tax saving strategies 2026 go far beyond higher 401(k) limits. For…

The Great Market Plunge of 2019
It was in this letter exactly a year ago that we sought to provide some perspective about the steep decline stocks had just experienced in the fourth quarter of 2018. Over the course of just a few trading sessions in December, the Dow Jones Industrial Average declined 12%, and the Russell 2000 small stock index fell 14%. The plunge sent the major market benchmarks into bear market territory (defined as a decline of 20% or more) for the first time in a decade.
The anxiety in the market was apparent heading into 2019. Despite that, we urged calm and caution:
The thing about moving to the perceived safety of less volatile investments like bonds and cash during a downturn is that, once the dust clears and the market turns up again, it usually turns up in a big way. Much of the recovery happens before most investors realize it, and big gains that were there for the taking by those who are fully invested are missed by those sitting on the sidelines.
— CAM Investor Solutions client letter, January 2019
As it turned out, that is exactly what transpired in 2019. Stocks across the globe went on a tear, posting gains well into double-digits. All of the damage done by the 2018 bear market was wiped away as market benchmarks closed 2019 at or near record highs:
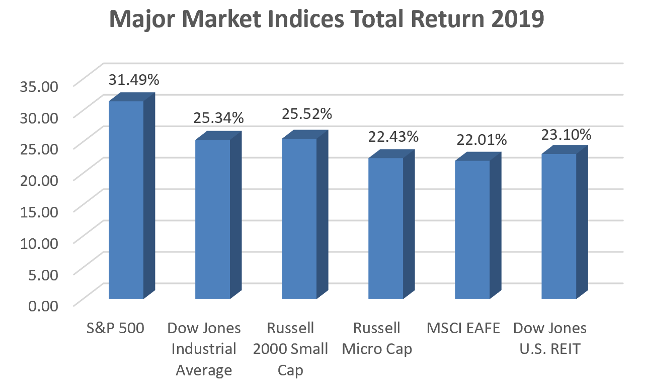
This isn’t to suggest that we had any divine insight about when stocks would recover. Sometimes bear markets come and go quickly, as this one did. Sometimes they are plodding and protracted, as the 1973-74 bear market was. And sometimes they are unnerving and traumatic, as the 2008-09 bear market proved to be.
The one constant in all of these examples, though, is that they all ran their course over time. There has never been a bear market that didn’t end eventually, and invariably the market surges upward when the dust has cleared. That’s what happened in 2019.
Predictably, the market doom-and-gloomers have changed the narrative and now are trying to convince us that stocks are too high. They point to the fact that the Dow has climbed from 6,470 in March 2009 to its present level (as of this writing) north of 29,000. Given that, it’s easy fodder for the talking heads to make the case that stocks are destined for a downturn.
It’s interesting, then, to look at the stock-market performance of this past decade compared to prior decades. When we do, we find that the strong performance of the 2010s was hardly out of the ordinary:
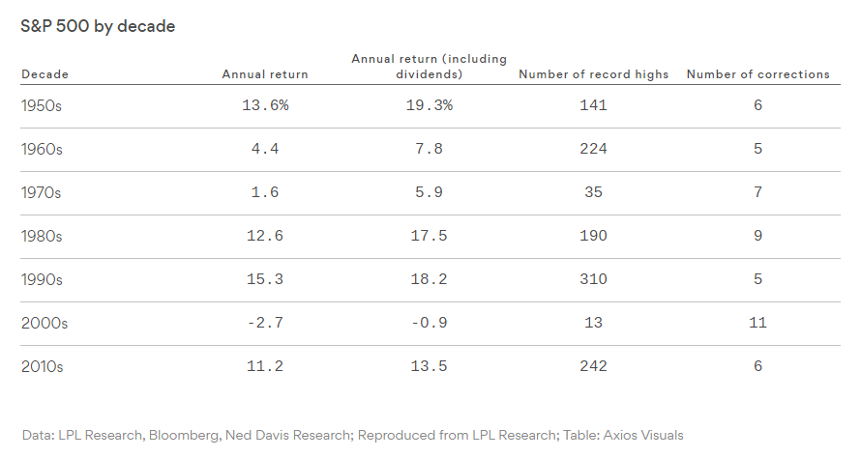
Clearly, the strong performance of stocks in the past decade doesn’t necessarily portend a big downturn on the horizon. But still the doom-and-gloomers appear on our TV screens and on our apps and computers to warn us things are just about to fall apart. Whether they are economists, hedge-fund managers, or former government officials, these perma-bears all sing from the same side of the hymnal: Something is fundamentally wrong with the economy/financial system/stock market and imminent doom awaits us all.
Interestingly, a recent study finally took some of the more high-profile perma-bears to task. The study dubbed them the “Armageddonists” and took a look at what the impact on a dollar would have been during the 2010s if an investor followed their advice to flee stocks and move to bonds:
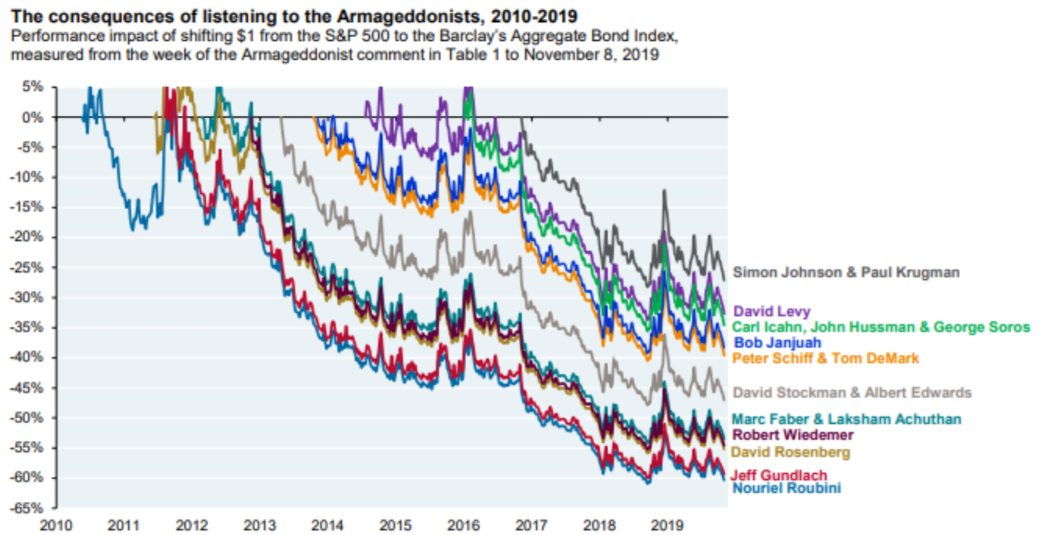
The damage done to an investor who followed the Armageddonists’ advice is staggering. Even the “best” performer of this group saw a 25% underperformance compared to the S&P 500. Most of the group saw underperformance in the range of 30% to 60%.
Alas, this is not anecdotal. Individual investors have proved susceptible to the Armageddonists time and time again, and 2019 was no different. Individual investors fled stocks in droves throughout 2019, even as stocks surged upward along the way. A December article in The Wall Street Journal reported that:
Investors have pulled $135.5 billion from U.S. stock-focused mutual funds and exchange-traded funds so far this year, the biggest withdrawals on record, according to data provider Refinitiv Lipper, which tracked the data going back to 1992…Investors have put roughly $277.2 billion into U.S. bond funds so far this year, the third-biggest sum over the past decade, while $482.8 billion has flowed into money-market funds, an 11-year high, according to Refinitiv.
— Investors Bail On Stock Market Rally, Fleeing Funds at
Record Pace, The Wall Street Journal, December 8, 2019
It’s both predictable and sad that individual investors react this way to market volatility. There’s little rational thought behind such behavior; it’s all based on emotion – specifically fear – as they become overwhelmed with negative information and opinions, much of it designed to spur exactly that kind of panicky behavior.
These are the dangers of letting emotions and hunches drive your investment strategy. What do investors who fled stocks in 2019 do now in 2020, with stocks back near record highs? If they jump back into equities and happen to catch another downturn, they will have essentially double-dipped on the downside. And if they wait until the next downturn comes, they will more than likely convince themselves, yet again, that such a downturn is no time to be investing in stocks. This is the dilemma of market timing – never knowing what to do and always being afraid you’ll make the wrong move no matter the market environment. It’s no way to manage an investment portfolio, and it may be a path to financial disaster. The better path is to let your financial plan drive your investment strategy.
As always, we are here to help.
Best,
Marc
Source: LPL Research; Bloomberg; Ned Davis Research; Axios Visuals; JP Morgan Asset Management; Capital Directions, LLC; Wall Street Journal December 8th, 2019 “Investors Bail on Stock Market Rally, Fleeting Funds at Record Pace”; M & A Consulting Group, LLC, doing business as CAM Investor Solutions is an SEC-registered investment adviser. As a fee-only firm, we do not receive commissions nor sell any insurance products. We provide financial planning and investment information that we believe to be useful and accurate. However, there cannot be any guarantees. This blog has been provided solely for informational purposes and does not represent investment advice or provide an opinion regarding the fairness of any transaction. It does not constitute an offer, solicitation, or a recommendation to buy or sell any particular security or instrument or to adopt any investment strategy. Any stated performance does not reflect the expenses associated with the management of an actual portfolio. Past performance is not a guarantee of future results. Diversification does not eliminate the risk of market loss. Charts and graphs provided herein are for illustrative purposes only. There are many different interpretations of investment statistics and many different ideas about how to best use them. Nothing in this presentation should be interpreted to state or imply that past results are an indication of future performance. Tax planning and investment illustrations are provided for educational purposes and should not be considered tax advice or recommendations. Investors should seek additional advice from their financial advisor or tax professional.

