Looking back at the market or stock "winners" makes it seem easy to predict the future winners. But how easy is it really?

How do Markets Perform in an Election Year?
Most people aren’t thinking about November and the end of the year in April – except when it’s an election year. As primary runoff elections are underway and we inch closer to the Presidential election we’re getting a lot of questions about how the election (in general) will affect the markets. We’re also hearing “which party is better for my portfolio?” It’s natural for investors to look for a connection between who wins the White House and which way stocks will go.
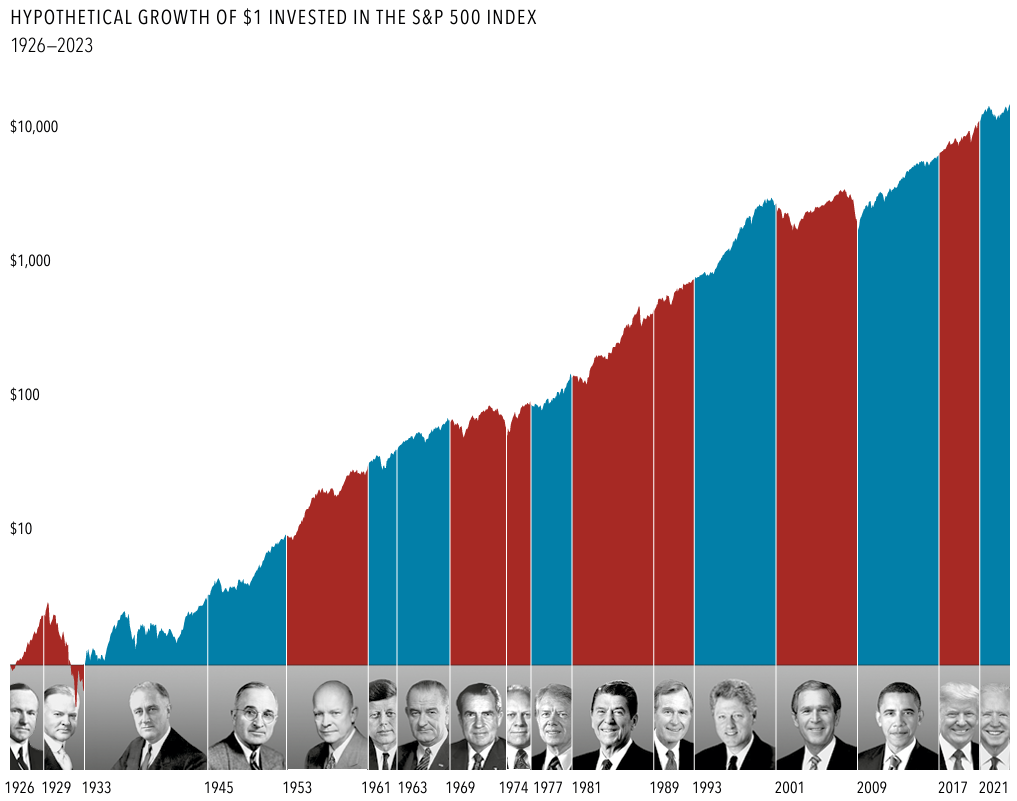
We have good news! Regardless of who wins, nearly a century of returns shows that stocks have trended upward, as shown in Image 1 below. So to answer your question – should you invest in an election year? Yes! You should stay invested and continue to invest throughout the year. We have an article about the benefits of continuing to invest over time. Just as in many things in life, consistency and discipline is the key to success.
The Market and Presidential Terms

See Disclosure for source information.
Why are markets not greatly affected by the election or a particular party? There are a few reasons. Mainly, shareholders are investing in companies, which focus on serving their customers and growing their businesses, regardless of who is in the White House. Do you stop shopping at a certain grocery store or delay buying a car from a particular manufacturing during an election year? Your every day purchases and activities (travel, life events, big purchases, etc) are generally not interrupted or altered just because it’s an election year.
If you’ve read or watched the news lately, you’ll notice there is a lot to report on. From Taylor Swift to housing and inflation to wars to interest rates. US presidents may have some impact on market returns, but so do many other factors—the actions of foreign leaders, the Federal Reserve, changing oil prices, and technological advances, just to name a few. It’s hard to weed out which headline is directly affecting the market one way or another.
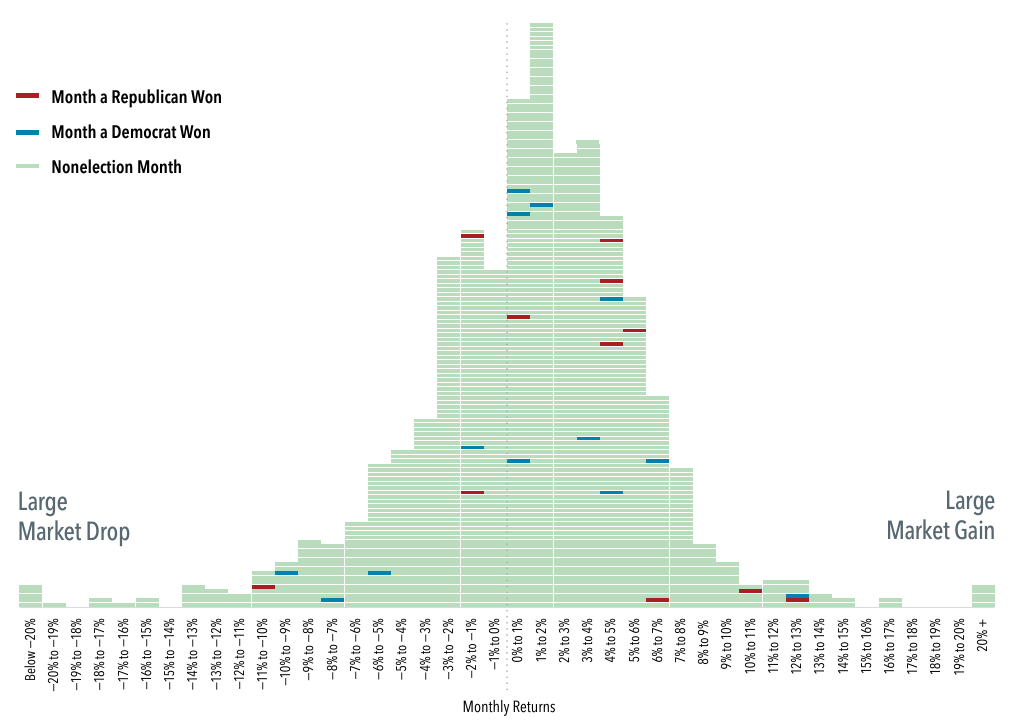
US PRESIDENTIAL ELECTIONS AND MONTHLY RETURNS

What about market performance in the month of November – election month? The history of the stock market going back to 1926 shows that returns in months when presidential elections took place don’t reflect any consistent patterns, as shown above in Image 2. This chart shows a broad-market US index, with each horizontal dash representing a month, arranged from left to right by market return in 1% increments. Most election months haven’t produced extreme returns in one direction or the other. The winning party hasn’t been a reliable driver for the direction or magnitude of market movements in election months, either. So come November, keep contributing to your 401(k) or retirement account and your brokerage accounts. Besides non-stop news headlines on your phone, November should be business-as-usual for you.
The history of market behavior during election months makes a strong case for sticking with a plan to achieve long-term goals. Stocks have rewarded disciplined investors for decades, through both Democratic and Republican presidencies. So don’t sit on the side lines – stay invested and keep investing through the year. Need help getting started or wondering if you need to make a change to your current investment portfolio? Let us help you.
Sources
Image 1 Source: S&P data © 2024 S&P Dow Jones Indices LLC, a division of S&P Global. All rights reserved. Data presented in the growth of wealth chart is hypothetical and assumes reinvestment of income and no transaction costs or taxes. The chart is for illustrative purposes only and is not indicative of any investment.
Image 2 Source: The Fama/French indices represent academic concepts that may be used in portfolio construction and are not available for direct investment or for use as a benchmark. Index returns are not representative of actual portfolios and do not reflect costs and fees associated with an actual investment.
Results shown during periods prior to each index’s inception date do not represent actual returns of the respective index. Other periods selected may have different results, including losses. Back tested index performance is hypothetical and is provided for informational purposes only to indicate historical performance had the index been calculated over the relevant time periods. Back tested performance results assume the reinvestment of dividends and capital gains.
CAM Disclosure
M & A Consulting Group, LLC, doing business as CAM Investor Solutions is an SEC registered investment adviser. As a fee-only firm, we do not receive commissions nor sell any insurance products. We provide financial planning and investment information that we believe to be useful and accurate. However, there cannot be any guarantees.
This blog has been provided solely for informational purposes and does not represent investment advice. Nor does it provide an opinion regarding fairness of any transaction. It does not constitute an offer, solicitation or a recommendation to buy or sell any particular security or instrument or to adopt any investment strategy.
Past performance is not a guarantee of future results. Diversification does not eliminate the risk of market loss. Tax planning and investment illustrations are provided for educational purposes and should not be considered tax advice or recommendations. Investors should seek additional advice from their financial advisor or tax professional.


