A softer-than-expected inflation report just changed the near-term outlook. Here's what…

Volatility Fatigue – Q1 2023
First Quarter 2023 saw stocks continue their roller-coaster ride that has been ongoing for more than a year now. Though most major market indices ended the quarter in the black, there was significant volatility along the way.
Turbulence in the stock market often leads to “volatility fatigue” for many investors, tempting them to throw in the towel and move into cash, locking in their losses in the process.
Sadly, recent data shows this is exactly what’s been happening with individual investors lately. According to the Investment Company Institute, total net assets in money market funds rose to a record $4.81 trillion in the week ended January 4th. That surpassed the prior record set in May 2020. You might recall May 2020 turned out to be in the early stages of a massive recovery in stocks. This early 2023 record has already been broken as money market funds sit at $5.28 trillion as of April 13th.
Is cash a good idea?
Fleeing to cash is a common response to volatility fatigue. This move is a bad idea in all economic environments, especially in a high-inflationary environment. As the rising costs of goods and services erodes purchasing power, a dollar buys less and less. With the U.S. inflation rate currently around 6% and 10-year Treasuries yielding a little more than 3%, investors who are moving large chunks of their assets to the perceived safety of cash are effectively losing money.
Source: Bloomberg1
Why we should care
It may not feel that way from day-to-day, but there’s no denying this reality in the long run. We recently came across the below image from a TIAA-CREF ad from 1997 that drove the point home in a jarring way:

The ad was intended to shock investors into understanding the caustic effects of inflation over time. What’s jarring about it now is just how accurate those prices seem today. While it’s certainly possible to get a burger and fries for less than $16 or buy a car for less than $65,000, anyone who’s eaten at a sit-down restaurant or wandered into a car dealership recently would have to agree those projections from 26 years ago seem pretty spot-on.
A better way
History shows time and again that the only reliable way for investors to maintain their purchasing power over the long run is with a significant allocation to stocks2. The problem is that many investors don’t really invest in stocks – they gamble with them. They jump from sector to sector, chasing performance and usually arriving late to the party. We’ve seen this in the past few years with the massive asset flows into (and out of) meme stocks, tech stocks and crypto currencies.
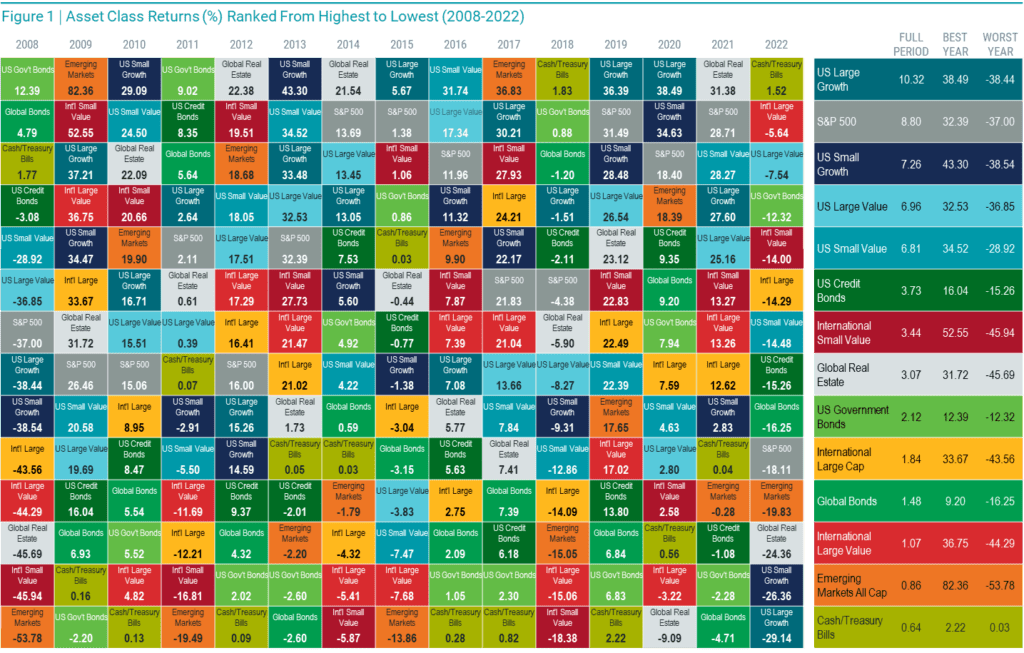
Asset class performance varies wildly from year to year, and it’s impossible to predict. In 2020, large growth stocks led the market by a wide margin. In 2021, Global REIT (real estate) stocks substantially outperformed all other asset classes. Then, in the 2022 bear market, value stocks performed much better than growth stocks3.
We believe there is a much better way to mitigate the effects of stock volatility and keep your purchasing power ahead of inflation: Diversification. Well-diversified portfolios don’t avoid volatility entirely, of course, but they do help smooth the edges. And potentially avoid the sort of catastrophic losses investors in concentrated portfolios have suffered in recent years.
How to avoid volatility fatigue
If that seems like common sense, well…it is. But as we’ve seen in the data above, most investors just can’t seem to avoid the temptation to chase performance and then flee to cash when stocks go into a downturn – a pattern that costs them untold wealth in the long run.
Are you ready to let go of the “volatility fatigue” you’ve been feeling? How do you avoid the temptation to switch to cash? How do you stay calm when it sounds like everything is moving constantly, and not in good directions? Tune out the noise! Turn off the television. Don’t listen to the financial entertainers that are trying to get you to “act”. When you trade, wall street makes money. Rather, try to be still, stay calm and give your portfolio a chance to weather the storm.
Sources:
1. Bloomberg and Morningstar. Past performance is no guarantee of future returns.
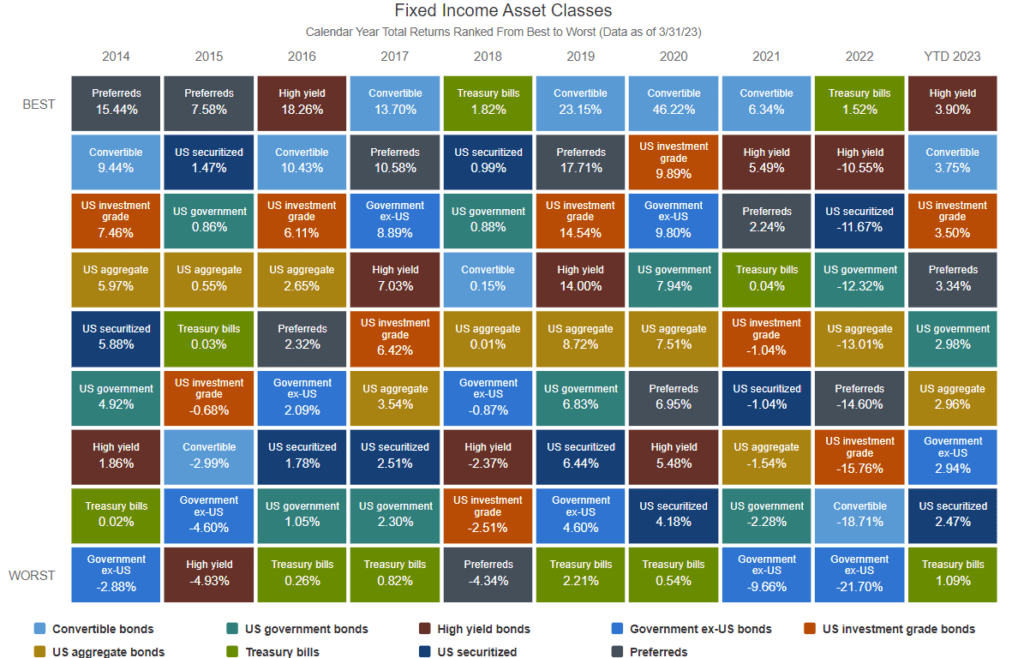
Convertible bonds are represented by the ICE BofA All US Convertibles Index (VXA0), a gauge of the performance of the US convertible market. US aggregate bonds are represented by the Bloomberg US Aggregate Bond Index, covers the US-denominated, investment grade, fixed rate, taxable bond market of SEC-registered securities. High yield bonds are represented by the Credit Suisse US High Yield Index, an unmanaged index of high yield debt securities. US government bonds are represented by the Bloomberg US Government Index, an unmanaged index considered representative of fixed income obligations issued by the US Treasury, government agencies and quasi-federal corporations.
Treasury bills are represented by the Bloomberg US Treasury Bill 1-3 Month Index, is a component of the Short Treasury Index and includes aged US Treasury bills, notes and bonds with a remaining maturity from 1 up to (but not including) 12 months. US investment grade bonds are represented by the Bloomberg US Corporate Investment Grade Index, consists of publicly issued, fixed rate, nonconvertible, investment grade debt securities. Global asset-backed securities are represented by the Bloomberg Global Asset Backed Index, a fixed income index that focuses on asset-backed securities and includes pass-through, controlled-amortization and bullet-structured securities, which have a minimum average life of one year. Government bonds ex. US are represented by the ICE BofA Global Government Bond Index, excluding US, tracks the performance of investment grade sovereign debt publicly issued and denominated in the issuer’s own domestic market and currency.
2. Morningstar Direct. S&P 500 Index real returns vs. One-Month US Treasury Bills real returns.
3. Avantis. Data over the 15-year period from 1/1/2008-12/31/2022. Source: Morningstar. Return periods greater than one year are annualized. The corresponding Russell indices represents U.S. size and style asset classes. The corresponding MSCI World ex USA indices represent international equity asset classes. Emerging markets equity is represented by the MSCI EM IMI Index. The corresponding Bloomberg Total Return indices represent bond asset classes. The S&P Global REIT Index represents global real estate. It is not possible to invest directly in an index.
CAM Investor Solutions Disclosures
M & A Consulting Group, LLC, doing business as CAM Investor Solutions is an SEC registered investment adviser. As a fee-only firm, we do not receive commissions nor sell any insurance products. We provide financial planning and investment information that we believe to be useful and accurate. However, there cannot be any guarantees.
This blog has been provided solely for informational purposes and does not represent investment advice. Nor does it provide an opinion regarding fairness of any transaction. It does not constitute an offer, solicitation or a recommendation to buy or sell any particular security or instrument or to adopt any investment strategy.
Past performance is not a guarantee of future results. Diversification does not eliminate the risk of market loss. Tax planning and investment illustrations are provided for educational purposes and should not be considered tax advice or recommendations. Investors should seek additional advice from their financial advisor or tax professional.

Related Posts