It’s been said that the stock market does not like surprises…

History and Presidential Elections
What History Tells Us About US Presidential Elections and the Market
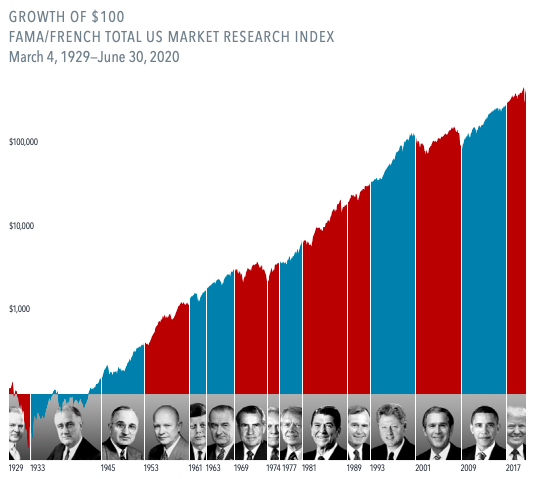
It’s natural for investors to look for a connection between who wins the White House and which way stocks will go. But as nearly a century of returns shows, stocks have trended upward across administrations from both parties.

Stocks have rewarded disciplined investors for decades, through Democratic and Republican presidencies. It’s an important lesson on the benefits of a long-term investment approach.Shareholders are investing in companies, not a political party. And companies focus on serving their customers and growing their businesses, regardless of who is in the White House.
US presidents may have an impact on market returns, but so do hundreds, if not thousands, of other factors—the actions of foreign leaders, a global pandemic, interest rate changes, rising and falling oil prices, and technological advances, just to name a few.
The anticipation building up to elections often brings with it questions about how financial markets will respond. But the outcome of an election is only one of many inputs to the market. Below is a link to an interactive exhibit that examines market and economic data for nearly 100 years of US presidential terms and shows a consistent upward march for US equities regardless of the administration in place. This is an important lesson on the benefits of a long-term investment approach.Follow this link to learn more about each presidency: Interactive Exhibit – Markets Under Each PresidencyAs always, we are here to help.
Best,
CAM Investor Solutions
Source: In US dollars. Stock returns represented by Fama/French Total US Market Research Index, provided by Ken French and available at http://mba.tuck.dartmouth.edu/pages/faculty/ken.french/data_library.html; US Government Presidential and Congressional data obtained from the History, Art & Archives of the United States House of Representatives. US Senate data is from the Art & History records of the United States Senate; Federal surplus or deficit as a percentage of gross domestic product, inflation, and unemployment data from Federal Reserve Bank of St. Louis (FRED). GDP Growth is annual real GDP Growth, using constant 2012 dollars, as provided by the US Bureau of Economic Analysis. Unemployment data not reported prior to April 1929; Dimensional Fund Advisors; M & A Consulting Group, LLC, doing business as CAM Investor Solutions is an SEC registered investment adviser. As a fee-only firm, we do not receive commissions nor sell any insurance products. We provide financial planning and investment information that we believe to be useful and accurate. However, there cannot be any guarantees. This blog has been provided solely for informational purposes and does not represent investment advice or provide an opinion regarding fairness of any transaction. It does not constitute an offer, solicitation or a recommendation to buy or sell any particular security or instrument or to adopt any investment strategy. Any stated performance does not reflect the expenses associated with the management of an actual portfolio. Past performance is not a guarantee of future results. Diversification does not eliminate the risk of market loss. Charts and graphs provided herein are for illustrative purposes only. There are many different interpretations of investment statistics and many different ideas about how to best use them. Nothing in this presentation should be interpreted to state or imply that past results are an indication of future performance. Tax planning and investment illustrations are provided for educational purposes and should not be considered tax advice or recommendations. Investors should seek additional advice from their financial advisor or tax professional.


