Have you heard of the S&P 500? Maybe someone told you that's all you needed to invest in to reduce investment risk. Is that true?

A Better Way Than Indexing
Imagine ringing in the new year in New York City’s Times Square with a million of your closest friends. Shortly after the ball drops, everyone is ready to leave—at the same time. Demand for a ride in that area soars, and so does the price for the suddenly coveted service. This dynamic surge is a lot like the index reconstitution effect, an important yet less-visible source of costs associated with index investing.
Index funds seek to mirror the performance of an index. To do that, they need to mirror the changes in the index’s holdings at the time of its reconstitution, when stocks are added to or dropped from the index. This lack of flexibility can lead to increased trading volume and price pressure around that reconstitution, the so-called index reconstitution effect.
Two of the most widely tracked indices in the US are the S&P 500 Index and the Russell 2000 Index. At the end of 2020, nearly $5.4 trillion in assets tracked the S&P 500. This means for every $1 invested in S&P 500 companies, 17 cents were indexed.1 An additional $191 billion in assets tracked the Russell 2000 as of 2019, meaning about 10 cents indexed for every $1 invested in Russell 2000 companies.2 With all of these assets tracking the indices, collective movements to mimic index changes may materially impact a security’s trading volume and price.
To examine the impact of index reconstitution on traded volumes and prices, we identify stocks that were added to or deleted from these two indices at an index reconstitution event over the past 10 years, from 2012 through 2021.3 Our sample includes 2,998 additions and deletions in total, with 50 additions and deletions coming from the S&P 500.
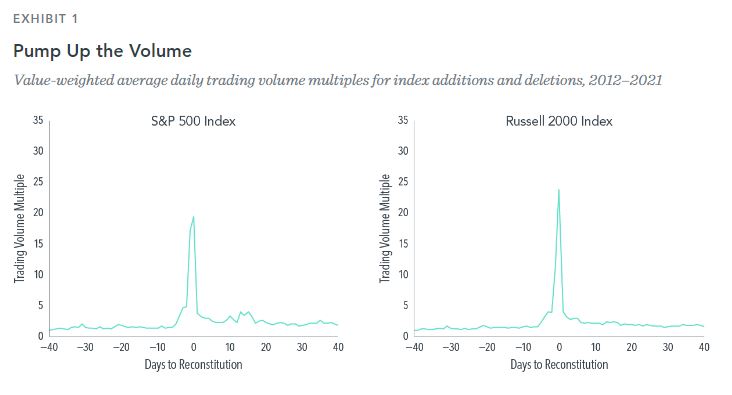
Exhibit 1 presents the value-weighted average trading volume for rebalanced stocks as a multiple of the stocks’ volume 40 trading days prior to reconstitution. For both the S&P 500 and Russell 2000, additions and deletions experience a large increase in trading volume around reconstitution, as much as 20 times higher for the S&P 500 and over 30 times higher for the Russell 2000, relative to volume before the reconstitution period.
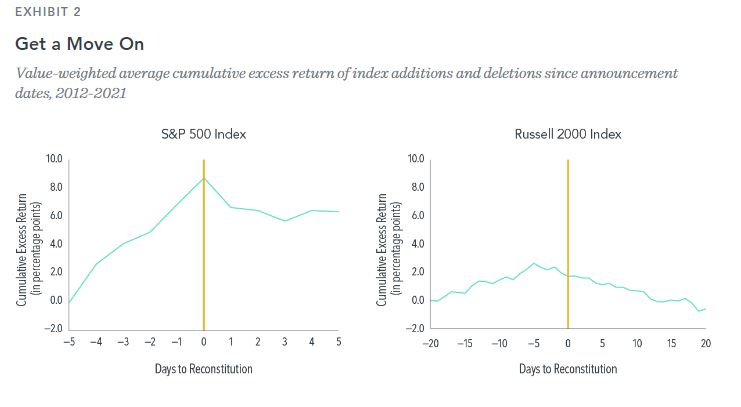
Since market prices are forward-looking and index rebalances are announced before reconstitution dates and often anticipated before announcement dates, the price impact due to index reconstitution often begins to accumulate before the actual reconstitution date. Indeed, we find that stocks that are added to an index tend to go up in price prior to rebalance, while deletions tend to go down.
Exhibit 2 presents the value-weighted average cumulative excess return to added or deleted stocks relative to the index. For both indices, we observe an increase in cumulative excess returns from the announcement date to the reconstitution date, followed by a reversal in excess return in the days following, on average. For example, for S&P 500 additions and deletions, the average cumulative excess return climbed to almost nine percentage points over the five days prior to reconstitution and dropped by more than two percentage points the following day.
Index investing has grown considerably in recent decades, with US equity index funds representing 52% of the US equity fund market at the end of 2021.4 While index funds typically offer lower expense ratios than actively managed funds, our study shows that there are potential hidden costs associated with rigidly following an index. Specifically, index fund investors end up buying index additions at high prices and selling index deletions at low prices. These results highlight the importance of flexibility and efficiency in portfolio design, portfolio management, and trading. A systematic daily investment process that rebalances thoughtfully and flexibly can help investors avoid the costs associated with demanding immediacy, while still providing many of the benefits of index investing.
Connect with us or check out our How We Invest page to learn more about how we implement a systematic investment process for our clients.
Disclosure 1: Data compiled by Dimensional. The security-level trade-volume multiple is based on the ratio of observed daily volume levels over the event horizon relative to the observed daily volume 40 days prior to the reconstitution date. Value-weighted average-trade volume multiple is calculated by weighting the set of trade-volume multiples each day by the securities’ respective free-float market capitalizations, which are month-end values from the most recent month prior to the trade date. We exclude additions and deletions for stocks that migrate to other popularly tracked indices in order to avoid the potential conflicting trading pressure; additions and deletions to the Russell 2000 exclude migration firms that were included in the Russell 1000 immediately prior to or immediately after the reconstitution date. Additions and deletions to the S&P 500 exclude migration firms that were included in the S&P MidCap 400 or S&P SmallCap 600 immediately prior to or immediately after the reconstitution date. For the S&P 500, reconstitution events that occur on triple-witching dates, or days on which stock index futures, stock index options, and stock options all expire simultaneously, are excluded. S&P data provided by Standard & Poor’s Index Services Group. Frank Russell Company is the source and owner of the trademarks, service marks, and copyrights related to the Russell Indexes. MSCI data © MSCI 2022, all rights reserved. Trading volume sourced from Bloomberg L.P. Multiples of t-40 volume is the trading volume at the specific time relative to trading volume at t-40 (40 days prior to index addition or deletion). Indices are unmanaged and cannot be invested into directly. Indices change their reconstitution dates and methodologies from time to time. The data depicted during the relevant period may reflect a number of different reconstitution practices. This data does not suggest that past performance will recur in future periods, as index reconstitution may be different in the future. Other simultaneous events, such as triple-witching dates, could lead to spikes in volume, in addition to reconstitution dates and fund trades that follow them.
Disclosure 2: Cumulative excess return (CER) is calculated as the cumulative sum of the daily excess returns for a given security vs. its respective index return. To examine deletions and additions together, the excess return for deletions is multiplied by –1. Value-weighted average CER is calculated by weighting the set of CERs on a day by the securities’ respective free-float market capitalizations, which are month-end values from the most recent month prior to the trade date. Additions and deletions to the Russell 2000 exclude migration firms that were included in the Russell 1000 immediately prior to or immediately after the reconstitution date. Additions and deletions to the S&P 500 exclude migration firms that were included in the S&P MidCap 400 or S&P SmallCap 600 immediately prior to or immediately after the reconstitution date. For the S&P 500, reconstitution events that occur on triple-witching dates, or days on which stock index futures, stock index options, and stock options all expire simultaneously, are excluded. S&P data provided by Standard & Poor’s Index Services Group. Frank Russell Company is the source and owner of the trademarks, service marks, and copyrights related to the Russell Indexes. MSCI data © MSCI 2022, all rights reserved. Indices are unmanaged and cannot be invested into directly. Indices change their reconstitution dates and methodologies from time to time.
M & A Consulting Group, LLC, doing business as CAM Investor Solutions is an SEC registered investment adviser. As a fee-only firm, we do not receive commissions nor sell any insurance products. We provide financial planning and investment information that we believe to be useful and accurate. However, there cannot be any guarantees. This blog has been provided solely for informational purposes and does not represent investment advice or provide an opinion regarding fairness of any transaction. It does not constitute an offer, solicitation or a recommendation to buy or sell any particular security or instrument or to adopt any investment strategy. Any stated performance does not reflect the expenses associated with the management of an actual portfolio. Past performance is not a guarantee of future results. Diversification does not eliminate the risk of market loss. Charts and graphs provided herein are for illustrative purposes only. There are many different interpretations of investment statistics and many different ideas about how to best use them. Nothing in this presentation should be interpreted to state or imply that past results are an indication of future performance. Tax planning and investment illustrations are provided for educational purposes and should not be considered tax advice or recommendations. Investors should seek additional advice from their financial advisor or tax professional.
Related Posts