Every year around this time, a familiar investing phrase begins circulating…

Inflation is Coming
As cities around the world continue to move forward at their own pace, the demand for goods and services continues to look different. While many are pricing in deflation in the near term, we think ALL investors should consider the implications of an inflationary environment going forward. But, let’s dive in and understand perhaps why and how this may impact you.
It’s tempting for future inflation expectations to be prominently influenced by the experiences of recent years. The University of Michigan’s Institute for Social Research publishes one of the most popular surveys of inflation expectations. Conducted monthly, the survey asks households to estimate expected price changes over the next 12 months. Figure 1 showcases inflation expectations on a monthly basis from 1978 onward. A steady level of inflation expectations since the mid-1980s has hovered around 3% with few spikes downward (2002) and upward (2008, 2011). There was a small downtick in the first three months of 2020 but nothing dramatic given the Fed’s large-scale asset purchase program intended to keep interest rates low and financial markets well-functioning to fight the COVID-19 recession.
Viewing this data suggests these inflationary expectations track actual inflation quite well. A 2007 Journal of Monetary Economics study involving a forecasting experiment shows that survey forecasts outperformed several alternatives, including simple predictive time-series models and others using real activity measures like economic growth and unemployment. Determining that these survey forecasts do well on their own is probably the study’s most provocative finding. Making adjustments to account for biases from reporting lags or combining forecasts with other approaches yield worse or no better out-of-sample forecasting performance.
Figure 1: Consumers’ Inflation Expectation Has Hovered Around 3% Since the Mid-1980’s | Survey of Consumers, University of Michigan: Inflation Expectation
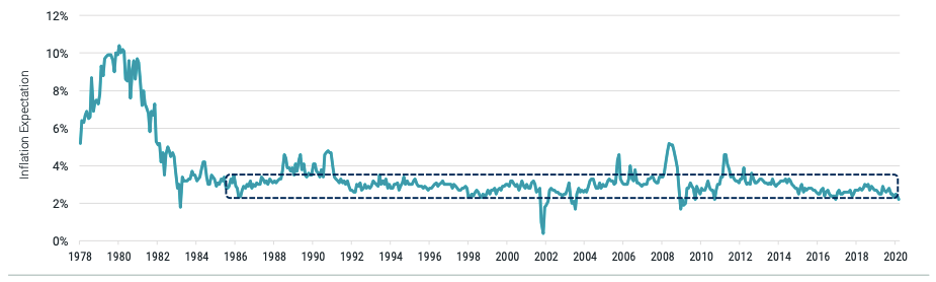
Data from 1/1/1978 – 3/1/2020. Source: the University of Michigan, Federal Reserve Bank of St. Louis.
While inflation is a measure of the average change over time in the prices for a market basket of goods and services of a typical American, fluctuations in food and energy prices, which tend to be volatile, can heavily influence short-term changes. Core inflation typically excludes these two categories and is often the focus of policymakers when they gauge inflationary pressures. Core inflation includes consumer durables that are long-lasting items, such as cars and refrigerators, non-durable goods that households use more quickly, and services like health care, transportation, financial, and recreation.
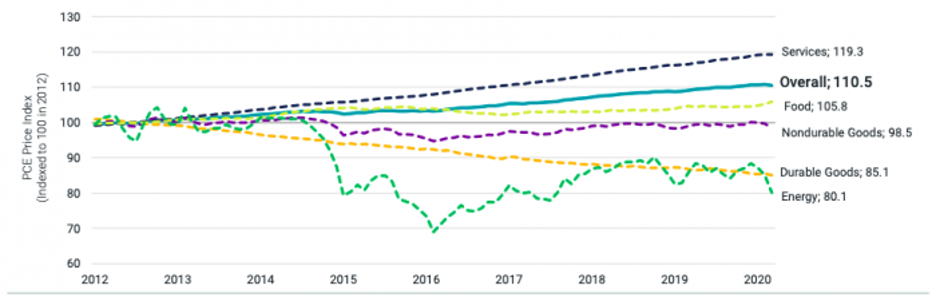
Figure 2 illustrates the differences between inflationary pressures over the past eight years. Using December 2012 as the starting point, we compound the index of personal consumption expenditures (PCE) through March 2020 to represent 10.5% (teal line, final index level of 110.5). The more volatile, down-trending (green) line is the sub-index of PCE for energy only. It indicates negative inflationary, or deflationary, pressures of -19% over that same period, especially in the first three months of 2020 during the COVID-19 crisis. We can also see a steady deflationary trend in PCE durable goods only (orange line). It wouldn’t be surprising to think assumptions about future expected inflation incorporated into a customized financial planning exercise might be influenced by the more salient components of a consumer’s (aka investor’s) basket of purchases.
Figure 2: Underneath the Overall Index, Consumer Prices Can Vary Greatly
Does the Fed Offer Useful Guidance?
Maybe experts at the Fed have a crystal ball that we could peek into? Indeed, the Fed explicitly states that an inflation rate of 2% per year is most consistent with its mandate for price stability and maximum employment over the long run. What we don’t know is which of the multiple measures of components of PCE that Fed officials study or what macroeconomic data they review to evaluate inflation trends. What we do know is that the Federal Open Market Committee (FOMC) releases transcripts and a statement to accompany its “projection materials” when meetings conclude. The Fed chair typically leads a press conference as well.
The statement for the December 10-11, 2019, meeting (issued December 11 at 2 p.m. EST) affirms that “on a 12-month basis, overall inflation and inflation for items other than food and energy are running below 2 percent.” The projection materials, which survey Federal Reserve Board members and Federal Reserve Bank presidents, report a median core PCE inflation rate for 2020 of 1.9% with a (central tendency) range of 1.9% to 2.0%.
Before putting too much weight on this form of central bank forward guidance, know that scholars have also drilled down into such statements with the goal of extracting information to guide forecasts of future expected inflation and market returns.
A 2018 Quarterly Journal of Economics study, for example, looks at a high-frequency 30-minute window surrounding scheduled Fed announcements to gauge whether expectations about inflation move as a result of news about monetary policy.It turns out a tightening of monetary policy does reduce inflation, as theory and our intuition would predict, but the responses are remarkably small. This could imply that forward guidance is already known to market participants, making it a no “new” news event.
Should the Market’s Breakeven Expected Inflation Rates Be a Guide?
This is a block of text. DCould the markets themselves help manage our inflation expectations better? The U.S. Treasury bond and Treasury Inflation-Protected Securities (TIPS) markets are two of the largest and most actively traded fixed-income markets in the world. TIPS are like Treasury bonds except the principal amount is adjusted over time to reflect changes in consumer prices to protect the investor. A fixed coupon rate is applied to a principal amount that changes in response to realized inflation (or deflation), so the actual semi-annual coupon the investor receives in dollars changes similarly. The difference between the nominal 10-year Treasury bond yield and the 10-year, inflation-adjusted TIPS yield implies the average rate bond market investors expect over the next 10 years. A 1% yield on a 10-year Treasury note associated with a 0.25% 10-year TIPS rate means an investor gets a so-called “breakeven inflation rate” of 0.75% per year over the next 10 years.
If that sounds low, examine Figure 3 which presents the daily 10-year breakeven inflation rate since 2015. It has hovered in the range of 1.40%- 2.00% for much of that time. While there has been a spike downward during the COVID-19 crisis to a historically low 0.50% in early March 2020, it has trended upward since—approaching 1.40% at the end of June. Some caution may be in order with these market-determined breakeven inflation rates. A 2014 Journal of Finance study shows that Treasury bonds are almost always assigned lower discount rates relative to TIPS— especially in times of increased market volatility.
Such market dislocation means these two types of securities aren’t otherwise equivalent but for the inflation protection mechanism in TIPS, as assumed above. Most importantly, the Treasury-TIPS price differentials can’t be used to reliably back out the market’s inflation expectations with a high level of accuracy, as the breakeven rates are biased downward. Despite this known bias, this method could still be used to inform inflation expectations for financial planning purposes so long as we are cognizant of the inherent limitations, much like many other inputs in a long-term financial plan forecast.
Figure 3: The Breakdown Inflation Rate Has Hovered between 1.40% and 2.00% for much of the Last Five Years.
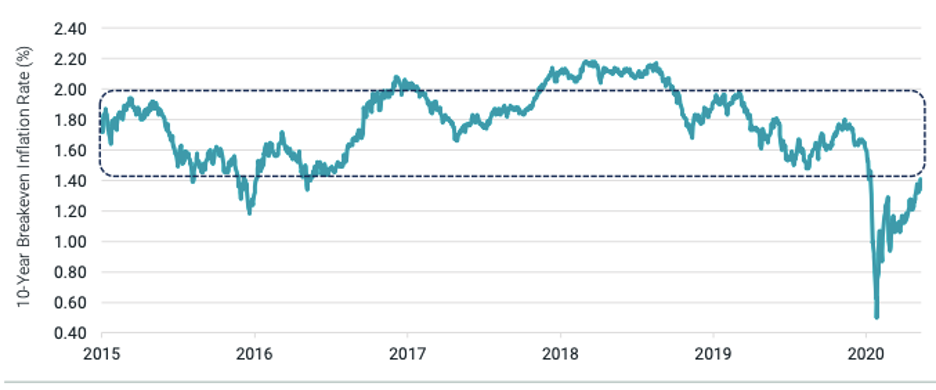 Data from 2/23/2015 – 6/30/2020. Source: Federal Reserve Bank of St. Louis. Breakeven inflation rate: The difference between the nominal yield (usually the market yield, which includes an inflation premium) on a fixed-income investment and the real yield (with no inflation premium) on an inflation-linked investment of similar maturity and credit quality. If inflation averages more than the breakeven rate, the inflation-linked investment will outperform the investment with the nominal yield. Conversely, if inflation averages below the breakeven rate, the investment with the nominal yield will outperform the inflation-linked investment.
Inflation Isn’t So Easy to Forecast
While the market’s implied forecasts for inflation aren’t reliable, there are few alternatives available to forecast it. Forward guidance from the Fed and other monetary policy authorities seems fraught. And extrapolating based on recent historical experience is likely more dangerous than ever in light of the COVID-19 recession and unprecedented Fed actions to counter its impact. Maybe the best strategy for financial planning is to anchor the Fed’s inflation target and guidance with the 10-year breakeven rate from the market. The most important takeaway is that each investor should work to build a diversified portfolio with an understanding that the actual path of inflation may be quite different than what was originally forecast. Monitoring and reassessing can help ensure nimble pivots in the allocation mix if the need arises.
As always we are here to help.
Best,
CAM Investor Solutions
Source: Avantis Investors; Certified Financial Planner Board of Standards (CFP Board); Board of Governors of the Federal Reserve System; M & A Consulting Group, LLC, doing business as CAM Investor Solutions is an SEC-registered investment adviser. As a fee-only firm, we do not receive commissions nor sell any insurance products. We provide financial planning and investment information that we believe to be useful and accurate. However, there cannot be any guarantees. This blog has been provided solely for informational purposes and does not represent investment advice or provide an opinion regarding the fairness of any transaction. It does not constitute an offer, solicitation or a recommendation to buy or sell any particular security or instrument or to adopt any investment strategy. Any stated performance does not reflect the expenses associated with the management of an actual portfolio. Past performance is not a guarantee of future results. Diversification does not eliminate the risk of market loss. Charts and graphs provided herein are for illustrative purposes only. There are many different interpretations of investment statistics and many different ideas about how to best use them. Nothing in this presentation should be interpreted to state or imply that past results are an indication of future performance. Tax planning and investment illustrations are provided for educational purposes and should not be considered tax advice or recommendations. Investors should seek additional advice from their financial advisor or tax professional.

Related Posts