SpaceX, OpenAI, & Anthropic IPOs are generating significant investor interest as…
Interest Rate Policy Just Shifted, Here’s Why
A softer-than-expected inflation report just changed the near-term outlook. Here’s what shifted, and what it means for your portfolio.
Interest rate policy expectations moved sharply this week after June’s CPI report came in softer than forecast, with consumer prices falling for the first time in six years. As of July 15, 2026, the Federal Reserve’s current policy rate, measured by the implied effective rate based on Overnight Index Swap pricing, stands at 3.63%. That single CPI data point reshaped how markets price the Fed’s next moves, from the July meeting through the rest of 2026.
How Interest Rate Policy Shifted After the July CPI Report
Before the CPI release, markets priced roughly a 40% chance of a rate hike at the Fed’s July 29 meeting. After the report, that probability dropped to under 17%. Pricing based on Overnight Index Swaps now implies a rate of about 3.67% for the July meeting, which works out to only about 4 basis points of additional tightening built in.
Expectations further out have shifted too, though more modestly. The September 16 meeting now implies a rate near 3.79%, pricing in roughly 13 basis points of cumulative hikes from current levels. Pricing for the October 28 meeting fell about 9.6 basis points on the day the CPI data came out. Traders have largely shifted their attention toward the possibility of hikes later in the year rather than at the July meeting itself.
Fed communication still points to a cautious stance. Fed Chair Kevin Warsh testified this week that the Fed has “no tolerance for persistently elevated inflation,” and the Fed is also moving away from forward guidance toward a more data-dependent approach. NY Fed President John Williams said current rates are “well positioned,” even as AI-driven demand adds upward pressure on inflation. You can track upcoming meeting dates and statements directly on the Federal Reserve’s own FOMC calendar.
At the June FOMC meeting, officials were split: nine projected at least one hike in 2026, six projected at least two, and nine expected no move or a cut. June producer price data released the same week showed core PPI up 4.7% year over year, slightly softer than expected.
Source: Bloomberg News
What the Yield Curve Says About Interest Rate Policy Ahead
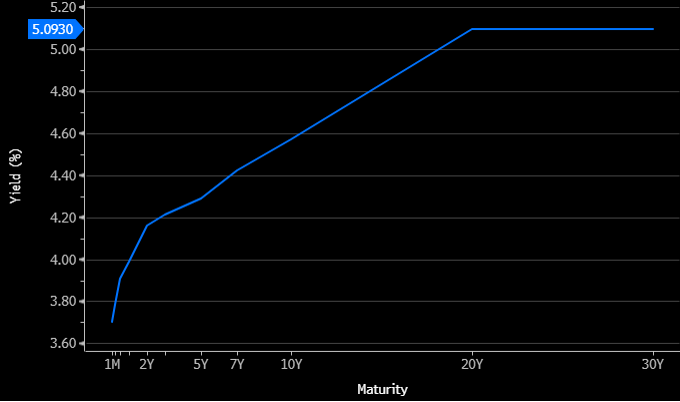
The current Treasury yield curve is upward sloping across the board:
| Maturity | Security | Yield (%) |
| 2-Year | T 4⅛ 06/30/28 | 4.164 |
| 5-Year | T 4⅛ 06/30/31 | 4.289 |
| 10-Year | T 4⅜ 05/15/36 | 4.569 |
| 30-Year | T 5 05/15/56 | 5.092 |
Yields run from about 3.70% at the 1-month maturity up to 5.09% at the 30-year. That’s a classic steepening pattern, and it tells a layered story about interest rate policy expectations at different time horizons.
The short end of the curve (1 month to 1 year) sits between 3.70% and 3.99%, closely anchored to the Fed’s current implied policy rate near 3.63%. That reflects limited expectations for a near-term hike. The belly of the curve (2 to 7 years) ranges from 4.16% to 4.42%, pricing in a modest tightening bias over the medium term. The long end (20 to 30 years) sits above 5%, which reflects persistent inflation concerns, fiscal deficit pressures, and elevated term premiums, consistent with Deutsche Bank’s forecast for 10-year yields to reach 4.8% by year-end.
The spread between 2-year and 10-year yields stands at about 41 basis points, a meaningfully positive slope. That shape tends to support financials, since banks benefit from wider net interest margins when the curve steepens this way.
Interest Rate Policy and the Bond Market: What to Expect
With yields sitting in the 4% to 5%-plus range since late 2025, bond returns in 2026 are expected to come primarily from carry rather than price appreciation. The broader fixed income outlook remains constructive given attractive yields, though historically tight credit spreads limit how much capital appreciation is realistic and offer less cushion against shocks. That backdrop favors higher-quality exposures over reaching for yield. PIMCO’s Andrew Balls has pointed to the 5- to 10-year segment of the curve as a favored hedge against volatility tied to the Fed’s shift away from forward guidance.
Interest Rate Policy and Stocks: Who Benefits, Who Doesn’t
Higher rates create a valuation headwind for equities broadly, since elevated yields make fixed income more attractive relative to stocks. Some signs point to a late-cycle phase for U.S. equities, including elevated valuations, speculative activity, and market concentration. The three largest U.S.-listed companies alone account for roughly 20% of total market cap.
Rate-sensitive sectors face the most direct pressure. Real estate, REITs, and utilities are the clearest examples. REIT dividend yields near 3.7% compare unfavorably to the 10-year Treasury at 4.57%. Financials and energy, by contrast, are positioned to benefit from a higher-for-longer rate environment.
Technology and growth stocks face valuation pressure if the Fed resumes hiking, while bond-proxy sectors like utilities and real estate could underperform in that scenario. Factor analysis from Barclays shows the Value factor tracking the 2-year yield closely, and a tightening environment has historically favored Value over Growth, though the current AI-driven cycle complicates that relationship.
None of this changes the case for staying diversified across sectors and asset classes rather than betting on any single outcome, a lesson that applies just as much to sector rotation as it does to asset class diversification broadly. And given how quickly rate expectations shifted this week alone, trying to time an exact entry or exit point around Fed decisions remains a losing game.
The Bottom Line on Interest Rate Policy
Markets have largely priced out a July rate hike following the soft CPI print, but the broader tightening bias remains intact given still-elevated inflation and a hawkish Fed leadership under Chair Warsh. The path beyond July stays uncertain and highly data-dependent. For investors, that argues for staying diversified, favoring quality across fixed income, and expecting continued volatility in rate-sensitive equity sectors.
Frequently Asked Questions
What is the Fed’s current interest rate policy? The Fed held rates steady at its June meeting, though officials were split on the path ahead. Nine members projected at least one hike in 2026, six projected at least two, and nine expected no move or a cut. Markets currently price a low probability of a hike at the July meeting following a softer-than-expected CPI report.
How does interest rate policy affect the stock market? Higher rates typically create a valuation headwind for stocks, since they make fixed income more attractive by comparison. Rate-sensitive sectors like real estate, REITs, and utilities tend to feel the most direct pressure, while financials and energy often benefit from a higher-for-longer environment.
Why is the Treasury yield curve steepening? The long end of the curve reflects persistent inflation concerns, fiscal deficit pressures, and elevated term premiums, while the short end stays anchored close to the Fed’s current policy rate. That combination produces the upward-sloping, steepening pattern currently in place.
What does this mean for bond investors? With yields elevated since late 2025, 2026 bond returns are expected to come mainly from carry rather than price gains. Tight credit spreads limit further capital appreciation potential, which favors higher-quality fixed income exposure over reaching for yield.
As always, CAM Investor Solutions is here to help.
* * * * * * * * * * * * * * * * * *
Historical performance results for investment indices, benchmarks, and/or categories have been provided for general informational/comparison purposes only, and generally do not reflect the deduction of transaction and/or custodial charges, the deduction of an investment management fee, nor the impact of taxes, the incurrence of which would have the effect of decreasing historical performance results. It should not be assumed that your account holdings correspond directly to any comparative indices or categories. Need to add more disclosures.
About CAM Investor Solutions
CAM Investor Solutions, a fee-only independent Registered Investment Advisor, has offices located in Colorado, Florida, and Texas. As a growing wealth management firm, we focus on the needs of our clients to improve their quality of life. Our firm’s commitment to innovation through rigorous academic research enhances how we serve a multi-generational audience.
CAM’s Specialties Include:
- Managing concentrated wealth
- Planning for stock and option compensation / company IPOs
- Advanced tax managed investment strategies
- Custom retirement income strategies
- Cash management
Contact:
CAM Investor Solutions
info@caminvestor.com
1-844-247-0787
https://caminvestor.com
CAM Disclosure
M & A Consulting Group, LLC, doing business as CAM Investor Solutions is an SEC registered investment adviser. As a fee-only firm, we do not receive commissions nor sell any insurance products. We provide financial planning and investment information that we believe to be useful and accurate. However, there cannot be any guarantees.
This blog has been provided solely for informational purposes and does not represent investment advice. Nor does it provide an opinion regarding fairness of any transaction. It does not constitute an offer, solicitation or a recommendation to buy or sell any particular security or instrument or to adopt any investment strategy.
Past performance is not a guarantee of future results. Diversification does not eliminate the risk of market loss. Tax planning and investment illustrations are provided for educational purposes and should not be considered tax advice or recommendations. Investors should seek additional advice from their financial advisor or tax professional.


Related Posts