We’ve said before that the most dangerous four words in investing…

How will interest rate cuts affect my portfolio?
The Federal Reserve (Fed) is on a mission. And by many accounts, that mission is going well.
After inflation rose throughout 2021, the Fed began raising the federal funds rate from near zero in early 2022. By July 2023, the central bank had taken the fed funds target range to 5.25-5.50%, where it has held since. After this rapid rise, the fed funds rate stood at its highest level in 22 years.
Over this time, we observed year-over-year inflation, as measured by the Consumer Price Index (CPI), falling from a peak of 9.1% as of June 2022 to 3.4% in December 2023. The Fed’s preferred inflation measure, the Personal Consumption Expenditures Price Index (PCE), ended 2023 at 2.6%. Core PCE, which excludes the more volatile food and energy sectors, ran at an annualized rate below 2% in six of the last seven months of 2023.
Meanwhile, economic growth hasn’t suffered in the way many predicted would follow rising rates. U.S. gross domestic product (GDP) grew 3.1% in 2023, beating many projections from the start of the year. The International Monetary Fund (IMF) projection for U.S. GDP in 2024 is still a healthy 2.1%.1
Calls for a “hard landing” for the economy have simply not materialized. To some, this suggests that the Fed’s tactics have so far proven successful.
In a recent Wall Street Journal opinion piece, renowned economist John Cochrane applauds the Fed for having “engineered a fundamental advance in monetary policy” over the past 15 years.2
In the old days, he says, the Fed raised rates by reducing bank reserves and the amount banks could lend. As a result of tighter money and credit conditions, the economy suffered. In 2008, things changed. The Fed began paying interest on reserves, incentivizing banks to maintain higher levels of reserves and liquidity.
Cochrane argues that this new policy approach seems to have allowed the Fed to raise rates to tame inflation without requiring credit crunches and recessions. And for that, he declares, “the Federal Reserve deserves a pat on the back.”
Multiple Rate Cuts Signaled in 2024
The popular view is that rate cuts are on the near-term horizon. The body officially responsible for monetary policy, the Federal Open Market Committee (FOMC), has suggested three quarter-point rate cuts in 2024. This is based on the median projection of FOMC members, taken in December 2023, on what the fed funds rate would be at year-end.3
At the January FOMC meeting, the Fed offered an update. Fed Chair Jerome Powell said a cut was unlikely at the policymakers’ next meeting in March. However, he was also clear that rate hikes are no longer a consideration for the committee and that rate cuts are still likely to begin in 2024. The question is when and how fast?
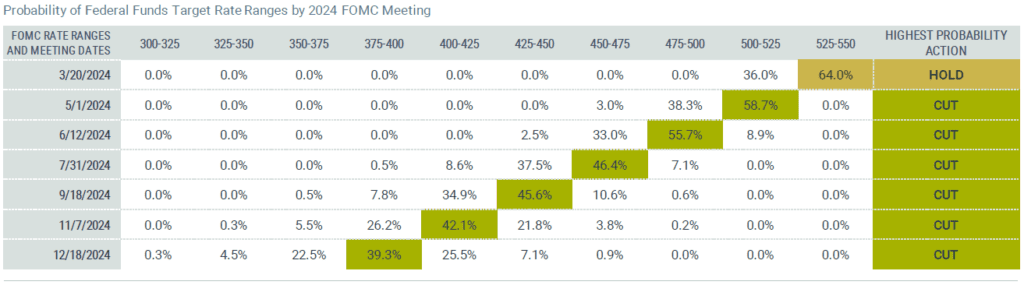
Current expectations from interest rate futures offer a perspective on the market’s view. As shown in Figure 1, prices on fed futures contracts suggest a rate cut is the highest probability outcome at the last six FOMC meetings of the year (albeit with a probability of around 60% or less at each meeting).
We can also infer an assigned probability of about 99% for at least four quarter-point rate cuts in 2024 and a 92% probability of five cuts.
A note of caution: This data can fluctuate daily and meaningfully on new information. However, although there is uncertainty around these projections, the data offer a clear picture of the aggregate market’s belief about the direction of rates.
Figure 1 | Fed Futures Prices Imply a High Expected Probability of Four or More Rate Cuts in 2024
What Rate Cuts Could Mean for Investors
What does this mean for investors? We believe there are a few important potential implications.
- Investors who hold significant levels of capital in higher-yielding cash or short-term Treasuries may not enjoy these same yield levels for much longer.
- Investors in the longer-duration, broad bond market may stand to benefit.
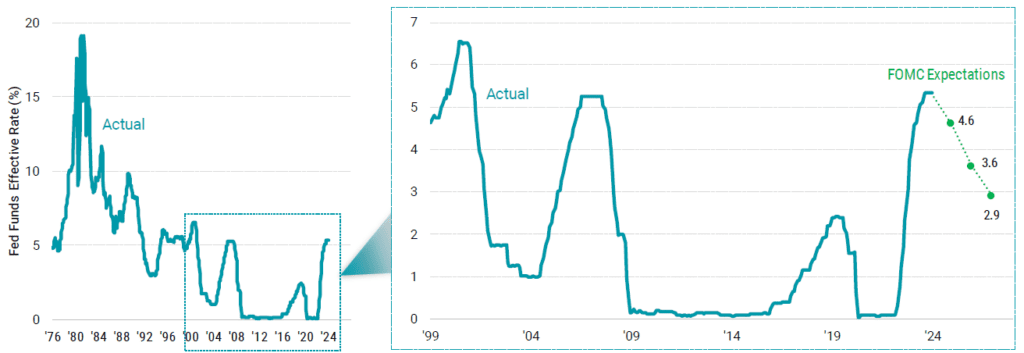
To illustrate, we looked back at the history of the fed funds rate and ran an experiment to examine how bonds have performed historically during different interest rate environments. Figure 2 shows the fed funds effective rate from 1976, spotlighting the last 25 years. Past periods of rapid rate increases stand out. What’s notable is that these prior periods have been followed by similarly quick rate declines. We include the FOMC median year-end projections in green for the next three years. We see a similar picture forming from the projected rate path.
Figure 2 | Periods of Rapid Fed Fund Rate Increases Have Been Followed by Quick Declines
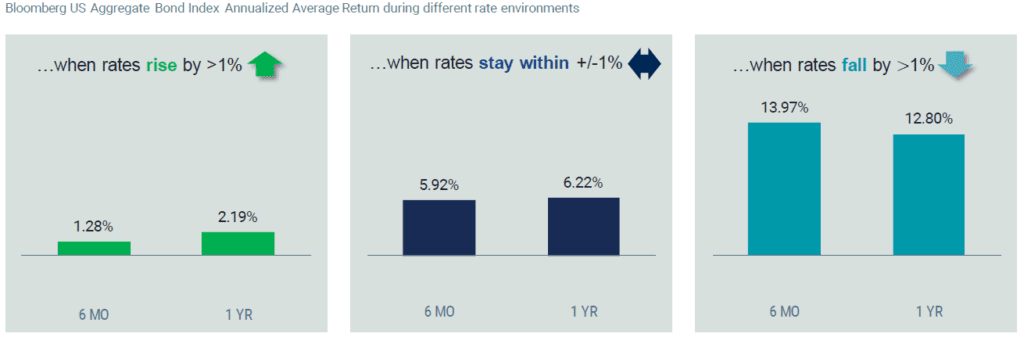
In Figure 3, we present the results of our experiment. To observe how the bond market (or core fixed income) performed in past interest rate environments, we used the Bloomberg US Aggregate Bond Index since its inception in 1976. We calculated returns during three environments: when rates rose by more than 1%, when rates were relatively stable and stayed within plus-or-minus 1%, and when rates fell by more than 1%. We identified each environment over two time horizons: six months and one year.
Annualized average returns are positive in all scenarios — even when rates rose by more than 1%. This highlights the multiple components of bond returns, including price appreciation (or depreciation) due to rate or yield changes and the yield itself. While a bond’s price will generally go down as the yield goes up, the bond’s yield can serve as a buffer. Higher yields offer greater protection against total return losses. Given current bond yields, this is good news for investors.
The more salient takeaway for investors today is that in periods when the fed funds rate fell by more than 1%, the bond market delivered meaningfully higher annualized average returns than in more stable and rising interest rate environments.
Figure 3 | Core Fixed Income Has Delivered meaningfully Higher Returns in Falling Rate Environments
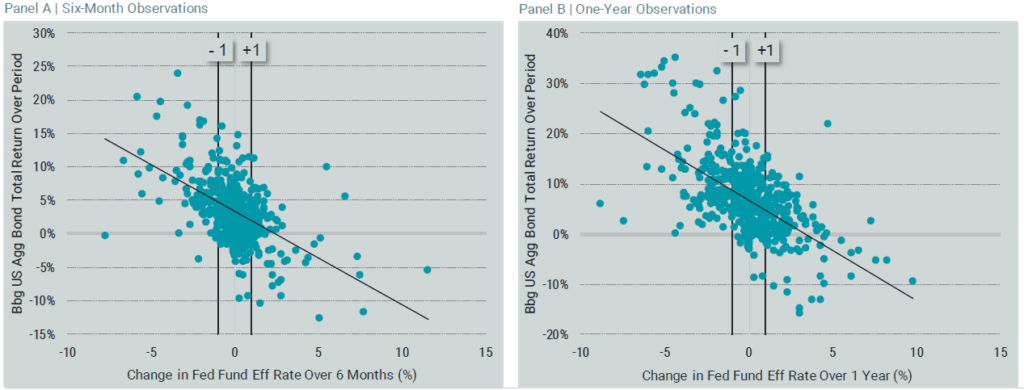
We offer a different lens on the data in Figure 4, plotting all six-month and one-year observations. We find negative slopes on the trend lines for both periods. While there are a few negative return observations when rates fell by more than 1%, the majority are positive. The charts demonstrate an inverse relation over the sample period with larger short-term rate cuts associated with higher contemporaneous returns from the bond market index.
It’s worth repeating that the exact pace and magnitude of future potential rate cuts is unknown. We may see rates move slower than current projections for 2024. Or they may move faster.
Figure 4 | Larger Short-Term Rate Cuts Have Historically Meant Higher Returns for Core Fixed Income
However, the data is clear that if anything like the path projected by the Fed or implied by the market occurs, a core-like fixed-income allocation would be expected to fare well. Investors who have shifted their portfolios to high levels of cash or short-duration bonds may have good reason to evaluate whether their current allocation is best suited to their goals. If you have questions about your own portfolio and how it might perform in a rate-cutting environment, please reach out. We’d be happy to provide a second opinion.
Disclosure
Sources: Avantis
1 Alan Rappeport, “Global Economy Is Heading Toward ‘Soft Landing,’ IMF Says,” New York Times, January 30, 2024.
2 John H. Cochrane, “The Federal Reserve Deserves a Pat on the Back,” Wall Street Journal, December 26, 2023.
3 Board of Governors of the Federal Reserve System, “Summary of Economic Projections in Conjunction with the Federal Open Market Committee Meeting of December 12-13, 2023,” December 13, 2023.
M & A Consulting Group, LLC, doing business as CAM Investor Solutions is an SEC registered investment adviser. As a fee-only firm, we do not receive commissions nor sell any insurance products. We provide financial planning and investment information that we believe to be useful and accurate. However, there cannot be any guarantees.
This blog has been provided solely for informational purposes and does not represent investment advice. Nor does it provide an opinion regarding fairness of any transaction. It does not constitute an offer, solicitation or a recommendation to buy or sell any particular security or instrument or to adopt any investment strategy.
Past performance is not a guarantee of future results. Diversification does not eliminate the risk of market loss. Tax planning and investment illustrations are provided for educational purposes and should not be considered tax advice or recommendations. Investors should seek additional advice from their financial advisor or tax professional.

Related Posts